Articles
- Page Path
- HOME > J Prev Med Public Health > Volume 53(3); 2020 > Article
-
Original Article
Verification of the Reliability and Validity of the Short Form 36 Scale in Indonesian Middle-aged and Older Adults -
Novita Intan Arovah1
 , Kristiann C. Heesch2
 -
Journal of Preventive Medicine and Public Health 2020;53(3):180-188.
DOI: https://doi.org/10.3961/jpmph.19.324
Published online: April 14, 2020
1Department of Health, Exercise and Recreation Education, Sports Science Faculty, Yogyakarta State University, Yogyakarta, Indonesia
2School of Public Health and Social Work and Institute of Health and Biomedical Innovation, Queensland University of Technology, Brisbane, Australia
- Corresponding author: Novita Intan Arovah, MD, PhD Department of Health, Exercise and Recreation Education, Sports Science Faculty, Yogyakarta State University, Colombo Street No 1, Karang Malang, Yogyakarta 55281, Indonesia E-mail: novita@uny.ac.id
Copyright © 2020 The Korean Society for Preventive Medicine
This is an Open Access article distributed under the terms of the Creative Commons Attribution Non-Commercial License (http://creativecommons.org/licenses/by-nc/4.0/) which permits unrestricted non-commercial use, distribution, and reproduction in any medium, provided the original work is properly cited.
ABSTRACT
-
Objectives
- The Short Form 36 (SF-36) questionnaire is increasingly being used to measure health-related quality of life (HRQoL) in Indonesia. However, evidence that it is valid for use in Indonesian adults is lacking. This study assessed the validity and reliability of the SF-36 in Indonesian middle-aged and older adults.
-
Methods
- Adults aged 46-81 years (n=206) in Yogyakarta, Indonesia completed the SF-36, another measure of HRQoL (the EuroQoL visual analogue scale [EQ-VAS]), and measures assessing their demographic characteristics. Fifty-four percent (n=121) completed the SF-36 measure again 1 week later. Confirmatory factor analysis was conducted to confirm the factor structure of the SF-36. Internal consistency reliability was estimated using Cronbach’s alpha, and test-retest reliability was assessed using intraclass correlations. Convergent and discriminant validity were assessed by computing correlations among SF-36 subscales, between subscales and the 2 component scores, and between component scores and EQ-VAS scores.
-
Results
- Most scaling assumptions were met. The hypothetical factor structure fit the data poorly (root mean square error of approximation [RMSEA]=0.108) and modification was required for a good fit (RMSEA=0.060). Scores on all subscales demonstrated acceptable internal consistency (α>0.70) and test-retest reliability (r>0.70). Divergent validity was supported by weak to moderate interscale correlations (r=0.19 to 0.64). As expected, the 2 summary scores were moderately to strongly correlated with the EQ-VAS (r>0.60).
-
Conclusions
- The findings adequately support the use of SF-36 in Indonesian middle-aged and older adults, although the optimal algorithm for computing component scores in Indonesia warrants further investigation.
- The population of Indonesia, like that of many other countries, is aging as a result of an increasing life expectancy and a declining birth rate [1,2]. The number of persons aged 60 years and more than in Indonesia is predicted to increase from 27.5 million in 2019 to 69.8 million by 2050, at which time this age group will account for 21% of the population [1,2]. This change will be a major public health burden [3] because older people are at an elevated risk of developing degenerative conditions, which increase their risk of all-cause morbidity [4-6]. Currently, more than one-third of Indonesian middle-aged and older adults are living with multiple morbidities, which may lower their quality of life now and in the future [7]. This highlights the importance of assessing health-related quality of life (HRQoL) in these age groups in Indonesia.
- HRQoL is a measure of individuals’ perceived physical, mental, and social well-being [3]. At the population-level, improvements in HRQoL are associated with reductions in health care resource demand and the number of person-years lost to illness/disability [8]. Therefore, it is increasingly being used for public health surveillance as an indicator of unmet healthcare needs and a predictor of mortality and morbidity [8]. It is also used by public health officials to allocate resources based on unmet needs, guide the development of health promotion programs, and monitor the effectiveness of these programs [8]. Thus, wide-reaching public health benefits can be achieved by assessing and improving HRQoL.
- A wide variety of general and disease-specific measures of HRQoL are available. The use of general instruments is often preferable because they allow for comparisons among population subgroups, such as those defined by age or health status. However, there are issues with using general HRQoL instruments in older adults. First, the questionnaire items included in these instruments are often worded to reflect the physical functioning of younger populations, and thus, they may inadvertently discriminate against older persons [9]. Second, there is often a poor relationship between HRQoL assessments in older populations and disability/disease severity [9]. In order to arrive at valid conclusions for use by policy-makers and practitioners, it is important to include older individuals in studies aiming to validate HRQoL instruments.
- The Short Form 36 (SF-36), originally constructed for use in the Medical Outcomes Study, is the general measure that has been most extensively used for measuring HRQoL in adults. Its reliability and validity have been evaluated in populations worldwide, including in Indonesia. For example, the Indonesian version of the SF-36 has been validated in patients with rheumatoid arthritis [10], hypertension [11], cancer [12], and cardiovascular disease [13]. However, the validity and reliability of the measure in the general population of Indonesian adults have not been reported. Also lacking in the published literature is evidence that the Indonesian version of the SF-36 satisfies the scoring assumptions underlying the construction of this multi-subscale measure. The evaluation of these assumptions is required to ensure that the algorithms used to generate SF-36 subscale and component scores can be applied to the Indonesian adult population. Given the increasing popularity of the SF-36 among researchers working in Indonesia, it is important to assure that it has the psychometric properties required for the interpretation of scores to be valid in this population. The overall aim of this study was to assess the validity and reliability of the Indonesian version of the SF-36 in middle-aged and older Indonesian adults. The specific objectives were to test the item scaling properties of this scale, its internal consistency and test-retest reliability, and its construct validity.
INTRODUCTION
- Study Design
- This study was a cross-sectional study assessing the psychometric properties of the Indonesian-translated SF-36 based on a guideline from the International Quality of Life Project [14,15].
- Study Sample
- It is generally considered that a minimum of 200 participants is required for factor analysis [16]. To recruit this number, the community leaders of 3 organizations that offered educational and health services to middle-aged and older adults in Yogyakarta, Indonesia invited their members (n=250) to participate. To be included, potential participants had to be more than 45 years of age and to be able to read and write in the local language. Those with mental or physical impairments that hindered participation were excluded. In total, 206 members (response rate, 82.4%) attended the initial visit, of whom 112 (54.4%) attended a follow-up visit 1 week later.
- Measures
- The SF-36 consists of 36 items [17]. The response options are on a 2-, 3-, 5-, or 6-point scale. Twenty-one items are used to generate the physical component summary (PCS) score, and 14 items are used to create the mental component summary (MCS) score. The PCS includes items from 4 subscales: physical functioning (PF), role limitation due to physical health (RP), bodily pain (BP), and general health perception (GH). The MCS includes items from the role limitations due to emotional problems (RE), vitality (VT), mental health (MH), and social functioning (SF) subscales [17]. The SF-36 also includes a health transition (HT) item, which is not included in the composite score. Descriptions of the composite items of each subscale and response options are presented in Supplemental Material 1. The mean score of the items within a subscale is computed to obtain the subscale score. The mean score of the subscale scores within a component scale is computed to generate the PCS and MCS scores. Higher scores indicate better HRQoL. The scale and component scores are not standardized [17].
- Another measure of HRQoL, the EuroQoL visual analogue scale (EQ-VAS), was used to validate the SF-36. This scale was selected because it is a concise measure that has been validated in an Asian population with similar characteristics to those of the current study population [18].
- Data Collection Procedures
- All data collection took place in the community halls of the 3 organizations. At the initial visit, participants were given a paper-based questionnaire packet to complete on their own. It contained social/demographic, SF-36, and EQ-VAS questionnaires. The first author explained the purpose of the study and was available to answer questions. Participants were invited to attend a follow-up visit 1 week later, at which they completed only the SF-36 again. At both visits, participants were provided with refreshments, but were not given monetary incentives for their participation.
- Statistical Analysis
- To assess whether the assumptions for creating subscales from the items were met [19], we used data collected from the initial visits with the participants to conduct 4 assessments. First, we assessed whether there was equality in item variance. All subscale items should have similar standard deviations (SDs) and means; otherwise, the computation of scores would require standardization. Second, we assessed the equality of item-subscale correlations. Subscale items should have similar corrected item-subscale correlations, which should be ≥0.40. Third, we assessed floor and ceiling effects. The percentage of participants with scores at the minimum value (floor) and maximum value (ceiling) should be less than 20% to ensure that a subscale captures the full range of responses in the population and that changes can be detected over time. Last, we assessed item discriminant validity, which specifies that the correlation between each item and its corresponding subscale should be significantly higher than its correlation with other subscales.
- We then conducted tests of subscale reliability and construct validity. Internal consistency reliability was assessed by calculating Cronbach’s alpha for each subscale and component scale. A Cronbach’s alpha value >0.70 was considered to signify acceptable internal consistency [20]. Furthermore, correlations between subscales should be less than their internal reliability coefficient if each scale measures a unique construct [19]. The 1-week test-retest reliability of each subscale was assessed by calculating the intra-class correlations (ICCs) of items within a subscale (1-way average model). An ICC >0.60 was considered good, while an ICC >0.75 was judged excellent [21].
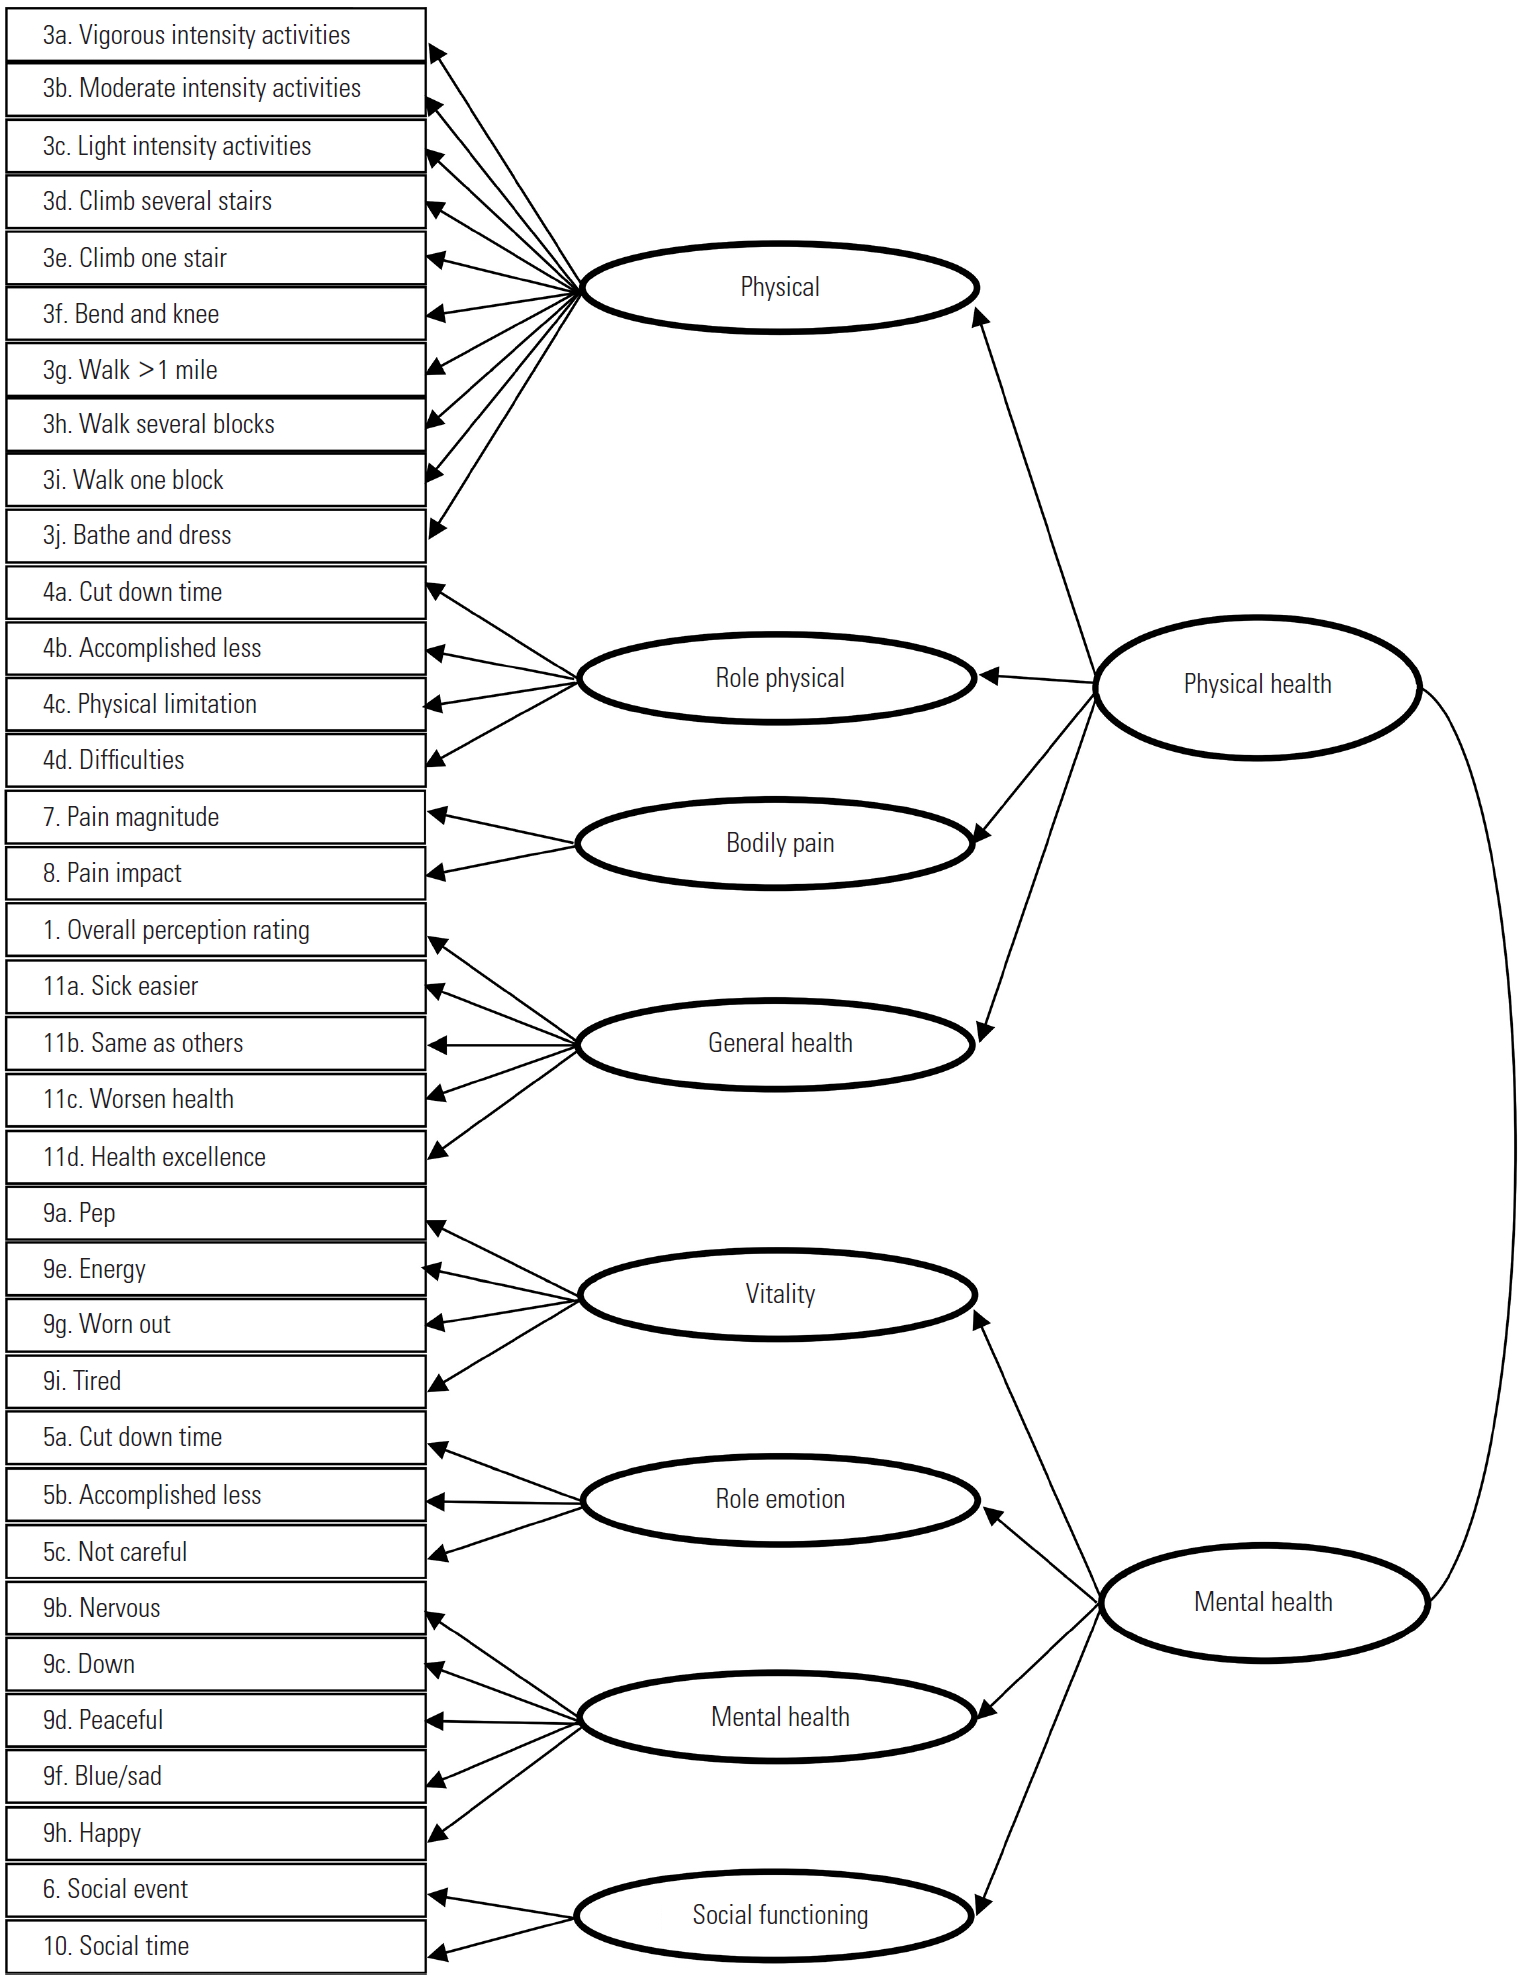
- For construct validity, we first conducted confirmatory factor analysis (CFA) to assess whether the hypothetical factor structure fit the observed data [15,22]. The hypothetical first and second-order factor analyses, as shown in Figure 1, were performed to allow correlations between component summaries [23,24]. Model modification indices were generated to guide model specification where the fit was poor. The goodness-of-fit statistics included the chi-square test (χ2) with degrees of freedom (df), the root mean square error of approximation (RMSEA) with a 90% confidence interval and p-value for close fit, the non-normed fit index (NNFI), the comparative fit index (CFI), the goodness and fitness index (GFI), and the standardized root mean square residual (SRMR). A good fit required a χ2/df ratio of less than 3 [25]. A RMSEA value <0.08 was considered to indicate good fit, a value between 0.08 and 0.10 to indicate mediocre fit, and a value >0.10 to indicate poor fit [26]. Values greater than 0.90 for CFI, GFI, and NNFI and values less than 0.08 for SRMR indicated an adequate fit between the hypothesized model and the observed data [27].
- Next, convergent and discriminant validity was assessed by correlating scores on subscales with the PCS and MCS [28]. Discriminant validity would be evident if the correlation between a subscale and its corresponding component score was higher than the correlation between the subscale and the other component score [12]. Convergent validity would be demonstrated if each component score was positively correlated with the EQ-VAS score.
- Data were analyzed using SPSS version 21.0 (IBM Corp., Armonk, NY, USA), except for CFA, for which Lisrel 8.80 (SSI Inc., Lincolnwood, IL, USA) was used. A p-value <0.05 was considered to represent statistical significance.
- Ethics Statement
- Participants provided written informed consent. The study protocol was approved by the Human Ethics Committee of Gadjah Mada University (approval No. KE/0142/02/2019).
METHODS
- Participant Characteristics
- In total, 206 participants (mean age, 62.4±7.7 years) completed the first round of data collection and thus were included in the scale and component score assessment and factor analysis. Fifty-four percent of the participants (n=112) completed the second round of data collection and were therefore included in the test-retest reliability study. As shown in Table 1, most participants were females, married, educated at a secondary level, non-smokers, and unemployed or retired. No statistically significant differences were found in demographic characteristics between participants who completed the testretest reliability study and those who did not.
- Assessment of Item-scaling Assumptions
- The psychometric properties of each item are summarized in Table 2 with additional details in Supplemental Material 2. No missing values were observed. The mean, SD, and the corrected item-subscale correlations were similar across items, except for 3 items. Those were items about general health (item 1), the ability to do vigorous activities (item 3a), and happiness (item 9h). The corrected item-subscale correlations of these items were below 0.40 (r=0.33, 0.34, and 0.31 for items 1, 3a, and 9h, respectively). Also noteworthy was that floor and ceiling effects were evident for the RE and RP subscales, and a ceiling effect was evident for the SF subscale, as shown in Table 2. However, 100% of items were correlated more highly with their corresponding subscale than with other subscales, which supports the discriminant validity of all subscales (Supplemental Material 2). The skewness and kurtosis values indicated that the subscales were not normally distributed.
- Factor Analysis
- As shown in Table 3, the goodness-of-fit statistics of the hypothetical first-order and second-order factor structure of the SF-36 indicated poor fit. The t-values and factor loadings of the items are presented in Supplemental Material 3. The second-order level was structurally modified based on the modification indices, which suggested that the SF and RE subscales be loaded onto PCS as well as onto MCS and that the GH and RP subscales be loaded onto MCS as well as onto PCS (Supplemental Material 4). These modifications resulted in a good fit of the data, as indicated by all goodness-of-fit statistics.
- Reliability and Convergent-divergent Validity
- Table 4 shows that the ICCs of all subscales were >0.70, indicating good to excellent test-retest reliability and that the Cronbach’s α of 7 subscales was >0.70, indicating acceptable internal consistency reliability. The Cronbach’s α values for all subscales were higher than the inter-subscale correlations, suggesting that each subscale measured a unique construct. The inter-subscale correlation coefficients ranged from very weak to weak (r=0.19 to 0.53) except for a moderate correlation between VT and MH (r=0.64), indicating that most subscales measured distinct constructs. This finding supports the discriminant validity of each subscale, except for VT and MT, which appear to be overlapping constructs.
- As shown in Table 4, PF, RP, BP, and GH were strongly correlated with PCS (r≥0.70), and VT, RE, MH, and SF were moderately to strongly correlated with MCS (r=0.65 to 0.80). These correlations were higher than those between each subscale and the other component summary, suggesting the discriminant validity of both component summaries. There was a strong correlation between PCS and EQ-VAS (r=0.75) and a moderate correlation between MCS and EQ-VAS (r=0.60). This finding indicates the convergent validity of the component summaries.
RESULTS
- This study was the first to examine the scaling properties, reliability, and validity of the SF-36 in a general Indonesian population. The findings support the scaling assumptions, internal consistency reliability, test-retest reliability, and construct validity of the Indonesian version of the SF-36 for use with middle-aged and older Indonesian adults.
- All items were equivalent and had corrected item-subscale correlations above 0.40, except for 3 items. This was an unexpected finding because it had not been found previously in other studies conducted in Indonesian populations. One of the items assessed perceptions of health in general, for which the mean item score was lower than those of the other GH subscale items, which indicates that perceptions of overall health were lower when measured by a single item than when measured as a subscale. The finding likely reflects the fact that most participants rated their health as “good” to “excellent,” and, therefore, there was little variation among responses, which reduced the correlation. The second item assessed the perceived ability to perform vigorous physical activities. The item’s low corrected correlation with RP and its mean score being the lowest in the RP subscale indicate that participants perceived themselves as having less ability to engage in vigorous physical activity than the less intense physical activities measured in the subscale, which would be expected for a population of middle-aged and older adults. Lastly, the low corrected itemscale correlation between an item that measured participants’ level of happiness and the RE subscale suggests that happiness was not strongly related to other cognitive states (e.g., ‘nervousness’ or ‘calmness’) in this population.
- Floor and ceiling effects were evident for the RP and RE subscales. This finding corroborates studies from Malaysia [29], Thailand [30] and Taiwan [31] that reported floor and/or ceiling effects for these subscales. This may be because the response options for these subscales were dichotomous. Furthermore, the participants in those studies and the current study were healthy, community-dwelling individuals, which may have resulted in limited variation in responses. We also found a considerable ceiling effect for the SF subscale, which may reflect the fact that our study population highly valued social networking. Overall, these floor and ceiling effects suggest that the subscales may not be sensitive enough to detect changes in the members of the population who are the most and least physically healthy (in terms of RP and RE). However, all items were more strongly correlated with their corresponding subscale than with the other SF-36 subscales, which signifies good discriminant validity of all subscales. These findings, thus, support the use of the summated rating method of creating SF-36 subscales without weighting or standardization.
- The ICCs and Cronbach’s α values of all subscales suggest acceptable test-retest and internal consistency reliability, thereby providing support for the reliability of the Indonesian version of the SF-36. However, CFA of the hypothesized structure indicated a poor fit. To obtain a good fit, the SF and RE subscales were allowed to load onto PCS, while the GH and RP subscales were allowed to load onto MCS. This need to modify the structure was not unexpected because previous psychometric studies of the SF-36, particularly those from Asian countries, have reported deviations from the hypothesized factor structure. For instance, a study from Iran [32] reported that all subscales were within its hypothesized structure, except the RE subscale loaded onto PCS and the GH subscale loaded onto MCS. A study from Brunei [33] reported that the SF and RE subscales loaded onto PCS, while the GH and BP subscales loaded onto MCS. Similarly, studies from China [34] and Singapore [35] reported that the SF and RE subscales loaded onto both PCS and MCS, while GH loaded onto MCS. Likewise, a study in Japan [36] showed loadings of the RE and GH subscales onto both PCS and MCS.
- The differences in the SF-36 factor structure found between studies conducted in Western countries and those found in some Asian countries could be due to differences in culture and customs. These differences, however, do not discredit the validity and reliability of the SF-36 in Asian populations. Rather, the findings call for investigations of the most appropriate scoring algorithm to cater to Asian populations. In response, alternative scoring algorithms for summary constructs have been developed. For example, a 3-component model developed in Japan has been suggested [36]. Further research is recommended to obtain the most appropriate algorithm for use in Indonesia.
- The convergent and divergent validity of each subscale and component scale were supported in this study. Each subscale was found to measure a unique construct. All subscale scores had moderate to strong correlations with their corresponding component scores, a finding that supports the algorithms used for creating the 2 component summary scores. PCS and MCS scores were also correlated moderately to strongly with EQ-VAS scores, which suggests adequate convergent validity of the component scores. The correlation with EQ-VAS was higher for PCS than MCS, possibly because the EQ-VAS asked participants to rate their health from the worst to the best, and they may have considered their physical health rather than their mental health when responding.
- Certain limitations of our study should be acknowledged. First, although the sample included in the factor analysis was sufficiently large (≥200) according to general recommendations, the sample may have not been adequate for evaluating the first-order hierarchical model of the SF-36, based on the number of observed participants per parameter. Nonetheless, the sample size was sufficient for evaluating the second hierarchical order. Second, our study participants displayed a variety of demographic characteristics; however, they were all healthy, community-dwelling middle-aged and older adults. Therefore, the generalizability of the findings will not extend to other populations, including frail adults in residential care and younger adults.
- In conclusion, this study provides adequate evidence that the Indonesian version of the SF-36 meets its scaling assumptions and has acceptable reliability and validity, based on the approach recommended by the International Quality of Life Project [15]. However, the algorithm for computing component scores in Indonesia warrants further investigation. Overall, these findings provide adequate evidence that the Indonesian version of the SF-36 is valid and reliable for use in community-dwelling, healthy Indonesian populations of middle-aged and older adults.
DISCUSSION
SUPPLEMENTAL MATERIALS
Supplementary Table 1.
Supplementary Table 2.
Supplementary Table 3.
Supplemental Material 4.
-
CONFLICT OF INTEREST
The authors have no conflicts of interest associated with the material presented in this paper.
-
FUNDING
This study was funded by the Post-Doctoral Research Grant 2019 from Yogyakarta State University Indonesia.
Notes
ACKNOWLEDGEMENTS
-
AUTHOR CONTRIBUTIONS
Conceptualization: NIA. Data curation: NIA. Formal analysis: NIA, KCH. Funding acquisition: NIA. Methodology: NIA, KCH. Project administration: NIA. Visualization: NIA. Writing - original draft: NIA, KCH. Writing - review & editing: NIA, KCH.
Notes

| Characteristics | Internal consistency reliability and validity studies (n = 206) | Test and retest reliability study (n = 112) | p-value1 |
|---|---|---|---|
| Sex | 0.12 | ||
| Female | 139 (67.5) | 85 (75.9) | |
| Male | 67 (32.5) | 27 (24.1) | |
| Age (y) | 0.33 | ||
| 40-49 | 14 (6.8) | 4 (3.6) | |
| 50-59 | 51 (24.8) | 21 (18.7) | |
| 60-69 | 106 (51.4) | 67 (59.8) | |
| >70 | 35 (17.0) | 20 (17.9) | |
| Marital status | 0.53 | ||
| Married | 152 (73.8) | 79 (70.5) | |
| Not married/widowed | 54 (26.2) | 33 (29.5) | |
| Education level (y) | 0.79 | ||
| Primary (1-6) | 27 (13.1) | 13 (11.6) | |
| Secondary (7-12) | 93 (45.1) | 55 (49.1) | |
| Tertiary (>12) | 86 (41.7) | 44 (39.3) | |
| Smoking status | 0.23 | ||
| Non-smoker | 192 (93.2) | 108 (96.4) | |
| Smoker | 14 (6.8) | 4 (3.6) | |
| Employment status | 0.90 | ||
| Employed | 23 (11.2) | 12 (10.7) | |
| Unemployed/retired | 183 (88.8) | 100 (89.3) |
| Subscale |
Equivalency |
Floor/Ceiling1 |
Corrected item-subscale correlations |
Item-subscale correlations |
Distribution |
|||||
|---|---|---|---|---|---|---|---|---|---|---|
| Mean range | SD range | Floor (%) | Ceiling (%) | Range | Success rate2 | Range | Success rate3 | Skewness | Kurtosis | |
| PF | 48.3-91.5 | 24.9-37.4 | 1.0 | 15.0 | 0.33-0.72 | 9/10 | 0.47-0.79 | 10/10 | -1.28 | 1.51 |
| RP | 56.3-64.6 | 47.9-49.5 | 24.3 | 39.8 | 0.64-0.74 | 4/4 | 0.80-0.86 | 4/4 | -0.53 | -1.33 |
| BP | 69.6.-82.5 | 21.9-23.2 | 0.5 | 18.4 | 0.57-0.57 | 2/2 | 0.88-0.89 | 2/2 | -0.80 | 0.36 |
| GH | 40.9-71.6 | 18.9-30.7 | 1.0 | 2.4 | 0.34-0.60 | 4/5 | 0.52-0.76 | 5/5 | -0.63 | 0.65 |
| VT | 62.7-69.7 | 28.5-29.6 | 1.0 | 3.4 | 0.43-0.56 | 4/4 | 0.69-0.78 | 4/4 | -0.71 | 0.32 |
| RE | 61.7-65.1 | 47.8-48.7 | 24.3 | 52.4 | 0.70-0.75 | 3/3 | 0.87-0.89 | 3/3 | -0.54 | -1.48 |
| MH | 73.6-78.1 | 22.5-27.7 | 1.0 | 11.2 | 0.31-0.61 | 4/5 | 0.58-0.76 | 5/5 | -0.96 | 1.24 |
| SF | 82.8-87.6 | 22.9-22.5 | 0.5 | 53.9 | 0.55-0.55 | 2/2 | 0.88-0.88 | 2/2 | -1.28 | 0.88 |
PF, physical function; RP, role limitation due to physical health; BP, bodily pain; GH, general health perception; VT, vitality; RE, role limitations due to emotional problems; MH, mental health; SF, social functioning.
1 The percentage of respondents with minimum and maximum responses.
2 The number of corrected item-subscale correlations ≥0.40 divided by the number of items in a given subscale.
3 The number of item-subscale correlations that were higher than the correlations between the item and other subscales, divided by the number of items in a given subscale.
ICC, intraclass correlation; PF, physical function; RP, role limitation due to physical health; BP, bodily pain; GH, general health perception; VT, vitality; RE, role limitations due to emotional problems; MH, mental health; SF, social functioning; PCS, physical component summary; MCS, mental component summary; EQ-VAS, EuroQOL visual analogue scale.
1 The associations among variables were calculated using Pearson correlation analysis and all were significant (p<0.001).
- 1. Department of Economic and Social Affairs; United Nations. World population prospects 2019. highlights; 2019 [cited 2020 Apr 14]. Available from: https://population.un.org/wpp/Publications/Files/WPP2019_10KeyFindings.pdf
- 2. Adioetomo SM, Mujahid G, Posselt H. Indonesia on the threshold of population ageing. 2014 [cited 2020 Apr 14]. Available from: https://indonesia.unfpa.org/sites/default/files/pub-pdf/BUKU_Monograph_No1_Ageing_03_Low-res.pdf
- 3. Karimi M, Brazier J. Health, health-related quality of life, and quality of life: what is the difference? Pharmacoeconomics 2016;34(7):645-649ArticlePubMedPDF
- 4. Bonomini F, Rodella LF, Rezzani R. Metabolic syndrome, aging and involvement of oxidative stress. Aging Dis 2015;6(2):109-120ArticlePubMedPMC
- 5. Amiri P, Hosseinpanah F, Rambod M, Montazeri A, Azizi F. Metabolic syndrome predicts poor health-related quality of life in women but not in men: Tehran Lipid and Glucose Study. J Womens Health (Larchmt) 2010;19(6):1201-1207ArticlePubMed
- 6. Assuncao N, Sudo FK, Drummond C, de Felice FG, Mattos P. Metabolic syndrome and cognitive decline in the elderly: a systematic review. PLoS One 2018;13(3):e0194990ArticlePubMedPMC
- 7. Hussain MA, Huxley RR, Al Mamun A. Multimorbidity prevalence and pattern in Indonesian adults: an exploratory study using national survey data. BMJ Open 2015;5(12):e009810ArticlePubMedPMC
- 8. Centers for Disease Control and Prevention. Measuring healthy days population assessment of health-related quality of life. 2000 [cited 2020 Apr 16]. Available from: https://www.cdc.gov/hrqol/pdfs/mhd.pdfArticle
- 9. Hickey A, Barker M, McGee H, O’Boyle C. Measuring health-related quality of life in older patient populations: a review of current approaches. Pharmacoeconomics 2005;23(10):971-993ArticlePubMed
- 10. Novitasari L, Perwitasari DA, Khoirunisa S. Validity of short form 36 (SF-36) Indonesian version on rheumatoid arthritis patients. Indones J Med Health 2016;7(3):80-86Article
- 11. Rachmawati Y, Perwitasari DA, Adnan A. The validation of the Indonesian version of the SF-36 questionnaire on hypertension patients in a public health centre in Yogyakarta. Pharm J Indones 2014;11(1):14-25. (Indonesian)
- 12. Perwitasari DA. Development the validation of Indonesian version of SF-36 questionnaire in cancer disease. Indones J Pharm 2012;23(4):248-253
- 13. Salim S, Yamin M, Alwi I, Setiati S. Validity and reliability of the Indonesian version of SF-36 quality of life questionnaire on patients with permanent pacemakers. Acta Med Indones 2017;49(1):10-16PubMed
- 14. Gandek B, Ware JE, Aaronson NK, Apolone G, Bjorner JB, Brazier JE, et al. Cross-validation of item selection and scoring for the SF-12 health survey in nine countries: results from the IQOLA Project. International Quality of Life Assessment. J Clin Epidemiol 1998;51(11):1171-1178ArticlePubMed
- 15. Ware JE Jr, Gandek B. Overview of the SF-36 health survey and the International Quality of Life Assessment (IQOLA) Project. J Clin Epidemiol 1998;51(11):903-912ArticlePubMed
- 16. Myers ND, Ahn S, Jin Y. Sample size and power estimates for a confirmatory factor analytic model in exercise and sport: a Monte Carlo approach. Res Q Exerc Sport 2011;82(3):412-423ArticlePubMed
- 17. Hays RD, Morales LS. The RAND-36 measure of health-related quality of life. Ann Med 2001;33(5):350-357ArticlePubMed
- 18. Shafie AA, Hassali MA, Liau SY. A cross-sectional validation study of EQ-5D among the Malaysian adult population. Qual Life Res 2011;20(4):593-600ArticlePubMedPDF
- 19. Leung YY, Ho KW, Zhu TY, Tam LS, Kun EW, Li EK. Testing scaling assumptions, reliability and validity of medical outcomes study short-form 36 health survey in psoriatic arthritis. Rheumatology (Oxford) 2010;49(8):1495-1501ArticlePubMedPDF
- 20. Sharma B. A focus on reliability in developmental research through Cronbach’s alpha among medical, dental and paramedical professionals. Asian Pac J Health Sci 2016;3(4):271-278Article
- 21. Cicchetti DV. Guidelines, criteria, and rules of thumb for evaluating normed and standardized assessment instruments in psychology. Psychol Assess 1994;6(4):284-290ArticlePDF
- 22. Ware JE Jr, Sherbourne CD. The MOS 36-item short-form health survey (SF-36):1. Conceptual framework and item selection. Med Care 1992;30(6):473-483ArticlePubMed
- 23. Tucker G, Adams R, Wilson D. Observed agreement problems between sub-scales and summary components of the SF-36 version 2 - an alternative scoring method can correct the problem. PLoS One 2013;8(4):e61191ArticlePubMedPMC
- 24. Hann M, Reeves D. The SF-36 scales are not accurately summarised by independent physical and mental component scores. Qual Life Res 2008;17(3):413-423ArticlePubMedPDF
- 25. Schreiber JB, Nora A, Stage FK, Barlow EA, King J. Reporting structural equation modeling and confirmatory factor analysis results: a review. J Educ Res 99(6):323-338Article
- 26. MacCallum RC, Browne MW, Sugawara HM. Power analysis and determination of sample size for covariance structure modeling. Psychol Methods 1996;1(2):130-149Article
- 27. Hu LT, Bentler PM. Cutoff criteria for fit indexes in covariance structure analysis: conventional criteria versus new alternatives. Struct Equ Modeling 1999;6(1):1-55Article
- 28. Williams B, Onsman A, Brown T. Exploratory factor analysis: a five-step guide for novices. J Emerg Prim Health Care 2010;8(3):990399Article
- 29. Sararaks S, Azman AB, Low LL, Rugayah B, Aziah AM, Hooi LN, et al. Validity and reliability of the SF-36: the Malaysian context. Med J Malaysia 2005;60(2):163-179PubMed
- 30. Lim LL, Seubsman SA, Sleigh A. Thai SF-36 health survey: tests of data quality, scaling assumptions, reliability and validity in healthy men and women. Health Qual Life Outcomes 2008;6: 52ArticlePubMedPMC
- 31. Tseng HM, Lu JF, Gandek B. Cultural issues in using the SF-36 Health Survey in Asia: results from Taiwan. Health Qual Life Outcomes 2003;1: 72ArticlePubMedPMC
- 32. Jafari H, Lahsaeizadeh S, Jafari P, Karimi M. Quality of life in thalassemia major: reliability and validity of the Persian version of the SF-36 questionnaire. J Postgrad Med 2008;54(4):273-275ArticlePubMed
- 33. Alhaji MM, Johan NH, Sharbini S, Abdul Hamid MR, Khalil MA, Tan J, et al. Psychometric evaluation of the Brunei-Malay SF-36 version 2 Health Survey. Asian Pac J Cancer Prev 2018;19(7):1859-1865PubMedPMC
- 34. Li L, Wang HM, Shen Y. Chinese SF-36 Health Survey: translation, cultural adaptation, validation, and normalisation. J Epidemiol Community Health 2003;57(4):259-263ArticlePubMedPMC
- 35. Thumboo J, Fong KY, Machin D, Chan SP, Leon KH, Feng PH, et al. A community-based study of scaling assumptions and construct validity of the English (UK) and Chinese (HK) SF-36 in Singapore. Qual Life Res 2001;10(2):175-188ArticlePubMed
- 36. Suzukamo Y, Fukuhara S, Green J, Kosinski M, Gandek B, Ware JE. Validation testing of a three-component model of Short Form-36 scores. J Clin Epidemiol 2011;64(3):301-308ArticlePubMed
REFERENCES
Figure & Data
References
Citations
- Comparisons between US norm-based two-component and Japanese norm-based three-component SF-36 summary scores in systemic lupus erythematosus patients
Sayuri Yamashita, Yasuhiro Katsumata, Naoko Konda, Rangi Kandane-Rathnayake, Eric F Morand, Masayoshi Harigai
Modern Rheumatology.2023; 33(3): 517. CrossRef - Health measurement instruments and their applicability to military veterans: a systematic review
Jane Jomy, P Jani, F Sheikh, R Charide, J Mah, R J Couban, B Kligler, A J Darzi, B K White, T Hoppe, J W Busse, D Zeraatkar
BMJ Military Health.2023; : e002219. CrossRef - ПРИМЕНЕНИЕ ПАРАМЕТРИЧЕСКИХ И ОПРОСНИКОВЫХ МЕТОДОВ ИССЛЕДОВАНИЯ ДИСКОГЕНННОГО БОЛЕВОГО СИНДРОМА У ВЗРОСЛЫХ
В. В. Трефилова, Н. А. Шнайдер
Вестник Северо-Восточного федерального университета имени М.К. Аммосова. Серия: Медицинские науки.2023; (3): 45. CrossRef - Evaluation of Patients Satisfaction Level and Quality of Life (QOL) Receiving Physical Therapy Care for Musculoskeletal Disorders in Public and Private Hospitals
Hafiz Muhammad Almas Sabir, . Maira, Amna Tariq , Maryam Naveed Sheikh, Hamna Rehman, Tamjeed Ghaffar, Kainat Malik, Urooj Manzoor, Kaiynat Shafique
THE THERAPIST (Journal of Therapies & Rehabilitation Sciences).2023; : 02. CrossRef - Political participation and the social media network of young Nigerians
Nwachukwu Andrew Egbunike
Journal of African Media Studies .2023; 15(3): 343. CrossRef - Social Relationships and the Health of Older Adults: An Examination of Social Connectedness and Perceived Social Support
Samuel Asante, Grace Karikari
Journal of Ageing and Longevity.2022; 2(1): 49. CrossRef - Application of Patient-Reported Outcomes in Back Pain in Adults: Part 1
V. V. Trefilova, N. A. Shnayder, M. A. Novitsky, O. A. Ovdienko, Z. A. Nurgaliev
Personalized Psychiatry and Neurology.2022; 2(2): 34. CrossRef - The effect of herbal formula consisting of Curcuma xanthorrhiza, Curcuma longa and Phyllanthus niruri on quality of life: Randomized controlled trial
F Novianto, Z Zulkarnain, D Ardiyanto, A Triyono, U Nisa, P R W Astana, U Fitriani
IOP Conference Series: Earth and Environmental Science.2021; 913(1): 012088. CrossRef - Calidad de vida relacionada con la salud en pacientes hipertensos que acuden a un policlínico ubicado en Los Olivos
Lourdes Sukeyko Matta Zamudio
Revista Cuidado y Salud Pública.2021; 1(2): 71. CrossRef
 PubReader
 ePub Link
 Cite
Cite