Articles
- Page Path
- HOME > J Prev Med Public Health > Volume 56(2); 2023 > Article
-
Original Article
Changes in the Hospital Standardized Mortality Ratio Before and During the COVID-19 Pandemic: A Disaggregated Analysis by Region and Hospital Type in Korea -
EunKyo Kang1,2
 , Won Mo Jang3, Min Sun Shin4, Hyejin Lee5,6, Jin Yong Lee4,6,7
 -
Journal of Preventive Medicine and Public Health 2023;56(2):180-189.
DOI: https://doi.org/10.3961/jpmph.22.479
Published online: March 20, 2023
- 1,589 Views
- 80 Download
1National Cancer Control Institute, National Cancer Center, Goyang, Korea
2Department of Family Medicine, National Cancer Center, Goyang, Korea
3Department of Public Health and Community Medicine, Seoul Metropolitan Government – Seoul National University Boramae Medical Center, Seoul, Korea
4HIRA Research Institute, Health Insurance Review and Assessment Service (HIRA), Wonju, Korea
5Department of Family Medicine, Seoul National University Bundang Hospital, Seongnam, Korea
6Department of Health Policy and Management, Seoul National University College of Medicine, Seoul, Korea
7Public Healthcare Center, Seoul National University Hospital, Seoul, Korea
- Corresponding author: Hyejin Lee, Department of Family Medicine, Seoul National University Bundang Hospital, 82 Gumi-ro 173beon-gil, Bundang-gu, Seongnam 13620, Korea, E-mail: jie2128@gmail.com
- Co-corresponding author: Jin Yong Lee, Public Healthcare Center, Seoul National University Hospital, 101 Daehak-ro, Jongno-gu, Seoul 03080, Korea, E-mail: jylee2000@gmail.com
- * Kang & Jang contributed equally to this work as joint first authors.
Copyright © 2023 The Korean Society for Preventive Medicine
This is an Open Access article distributed under the terms of the Creative Commons Attribution Non-Commercial License (https://creativecommons.org/licenses/by-nc/4.0/) which permits unrestricted non-commercial use, distribution, and reproduction in any medium, provided the original work is properly cited.
ABSTRACT
-
Objectives
- The coronavirus disease 2019 (COVID-19) pandemic has led to a global shortage of medical resources; therefore, we investigated whether COVID-19 impacted the quality of non-COVID-19 hospital care in Korea by comparing hospital standardized mortality rates (HSMRs) before and during the pandemic.
-
Methods
- This retrospective cohort study analyzed Korean National Health Insurance discharge claim data obtained from January to June in 2017, 2018, 2019, and 2020. Patients’ in-hospital deaths were classified according to the most responsible diagnosis categories. The HSMR is calculated as the ratio of expected deaths to actual deaths. The time trend in the overall HSMR was analyzed by region and hospital type.
-
Results
- The final analysis included 2 252 824 patients. In 2020, the HSMR increased nationwide (HSMR, 99.3; 95% confidence interval [CI], 97.7 to 101.0) in comparison to 2019 (HSMR, 97.3; 95% CI, 95.8 to 98.8). In the COVID-19 pandemic zone, the HSMR increased significantly in 2020 (HSMR, 112.7; 95% CI, 107.0 to 118.7) compared to 2019 (HSMR, 101.7; 95% CI, 96.9 to 106.6). The HSMR in all general hospitals increased significantly in 2020 (HSMR, 106.4; 95% CI, 104.3 to 108.5) compared to 2019 (HSMR, 100.3; 95% CI, 98.4 to 102.2). Hospitals participating in the COVID-19 response had a lower HSMR (HSMR, 95.6; 95% CI, 93.9 to 97.4) than hospitals not participating in the COVID-19 response (HSMR, 124.3; 95% CI, 119.3 to 129.4).
-
Conclusions
- This study suggests that the COVID-19 pandemic may have negatively impacted the quality of care in hospitals, especially general hospitals with relatively few beds. In light of the COVID-19 pandemic, it is necessary to prevent excessive workloads in hospitals and to properly employ and coordinate the workforce.
- The rapid increase in coronavirus disease 2019 (COVID-19) patients has forced medical resources to be conserved worldwide. Since December 2019, when the first cluster of COVID-19 was reported [1], COVID-19 has become a global pandemic [2]. Due to the rapid increase in COVID-19 patients, a shortage of hospital beds was expected; therefore, to conserve medical resources, including hospital beds, the Centers for Disease Control and Prevention (CDC) recommended deferring elective procedures for stable, chronic-status patients [3]. Additionally, with social distancing and restrictions on using medical services due to COVID-19, there was a global decrease in all non-COVID-19 outpatient, inpatient, and emergency services and overall treatment procedures [4–8].
- Therefore, it is necessary to examine not only the direct health effects of COVID-19, but also its indirect health effects. Several studies have shown that a change in the mortality rate is the most important indicator of health effects due to the COVID-19 epidemic [9,10]. Studies have reported a decrease in hospitalizations and an increase in in-hospital mortality [11], or an increase in direct [10] or indirect mortality due to limited testing capacity and causes of death other than COVID-19 [9]. A study of all-cause mortality in 21 industrialized countries also confirmed that more people died from mid-February to May 2020 because of COVID-19 than had the pandemic not occurred [12].
- The pathways contributing to indirect excess death in the COVID-19 pandemic might include the loss of wages or housing, interruption of medical services due to outpatient facility suspension, hospital or emergency department avoidance, postponement of surgery or chemotherapy, and loss of health insurance [13,14]. The causes of indirect deaths from the COVID-19 pandemic, which could persist for years, will not be as straightforward to elucidate because economic and social disruptions intersect in complex ways, influencing morbidity and mortality. Although the indirect mortality rate is difficult to determine, it can be estimated by comparing the observed mortality rate based on prior years, with the difference between the two (i.e., the “excess deaths”) including direct deaths from COVID-19 [15]. The indirect mortality rate could be identified by excluding direct mortality (i.e., the excess mortality rate).
- In this study, we used hospital standardized mortality rates (HSMRs) as an index for monitoring health effects, especially the quality of clinical care, in the context of COVID-19. The HSMR is a good index reflecting inpatient care quality, despite certain limitations [16,17]. Considering the potential pitfalls of HSMR when comparing individual hospitals, assessing changes over time in groups of hospital types or regions is a useful way to measure inpatient care quality.
- This study aimed to examine whether the COVID-19 pandemic affected the quality of hospital-level hospitalization services, as measured by the HSMR. To identify any inpatient services that were particularly affected by local COVID-19 epidemics, a comparative analysis by COVID-19 epidemic/non-epidemic region and hospital size was conducted.
INTRODUCTION
- Data Source and Study Cohort
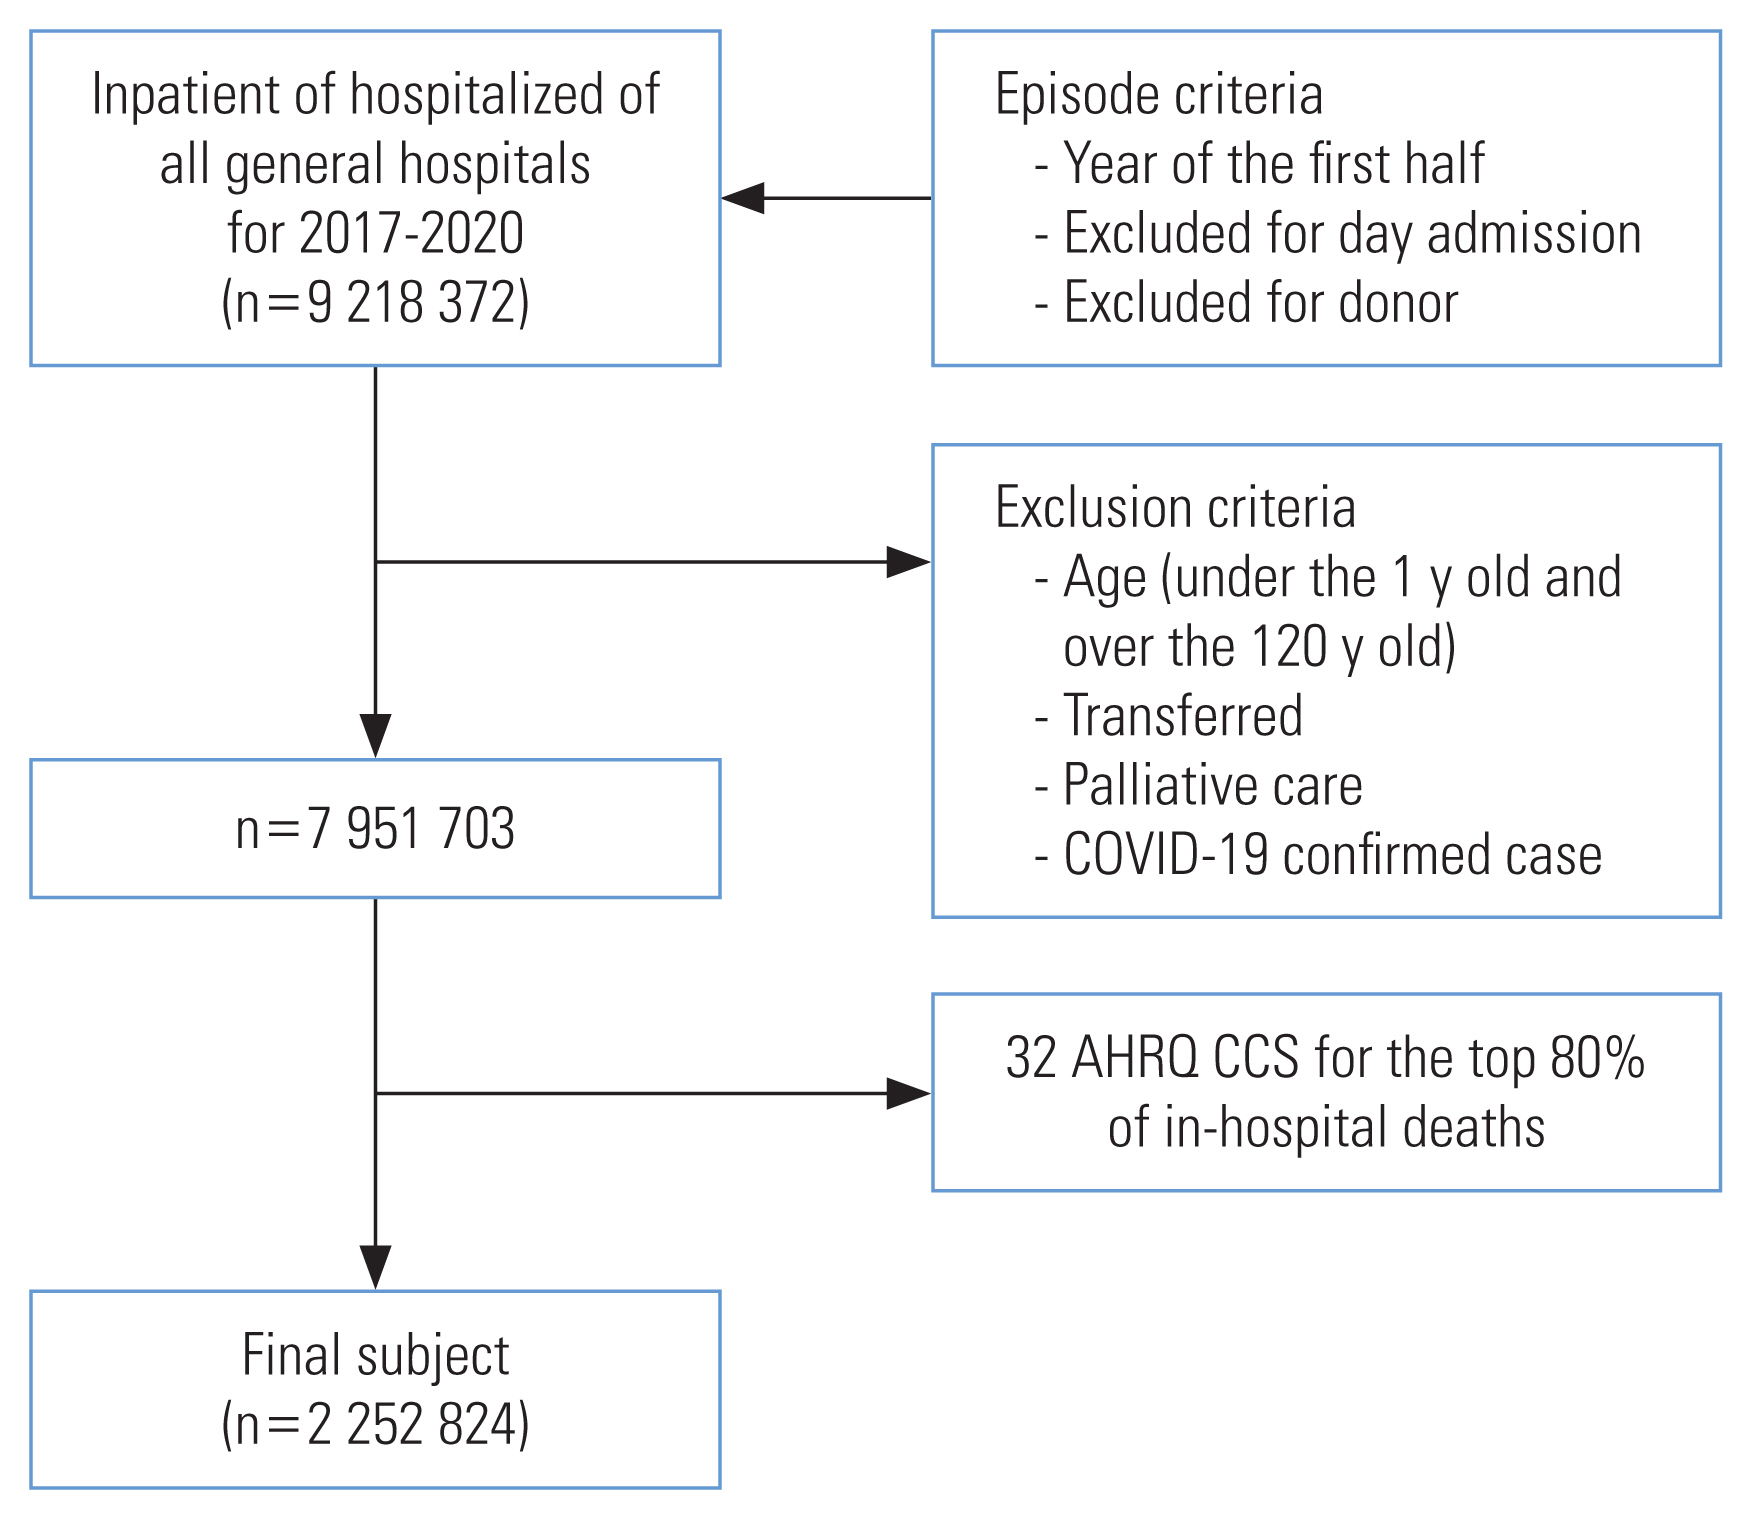
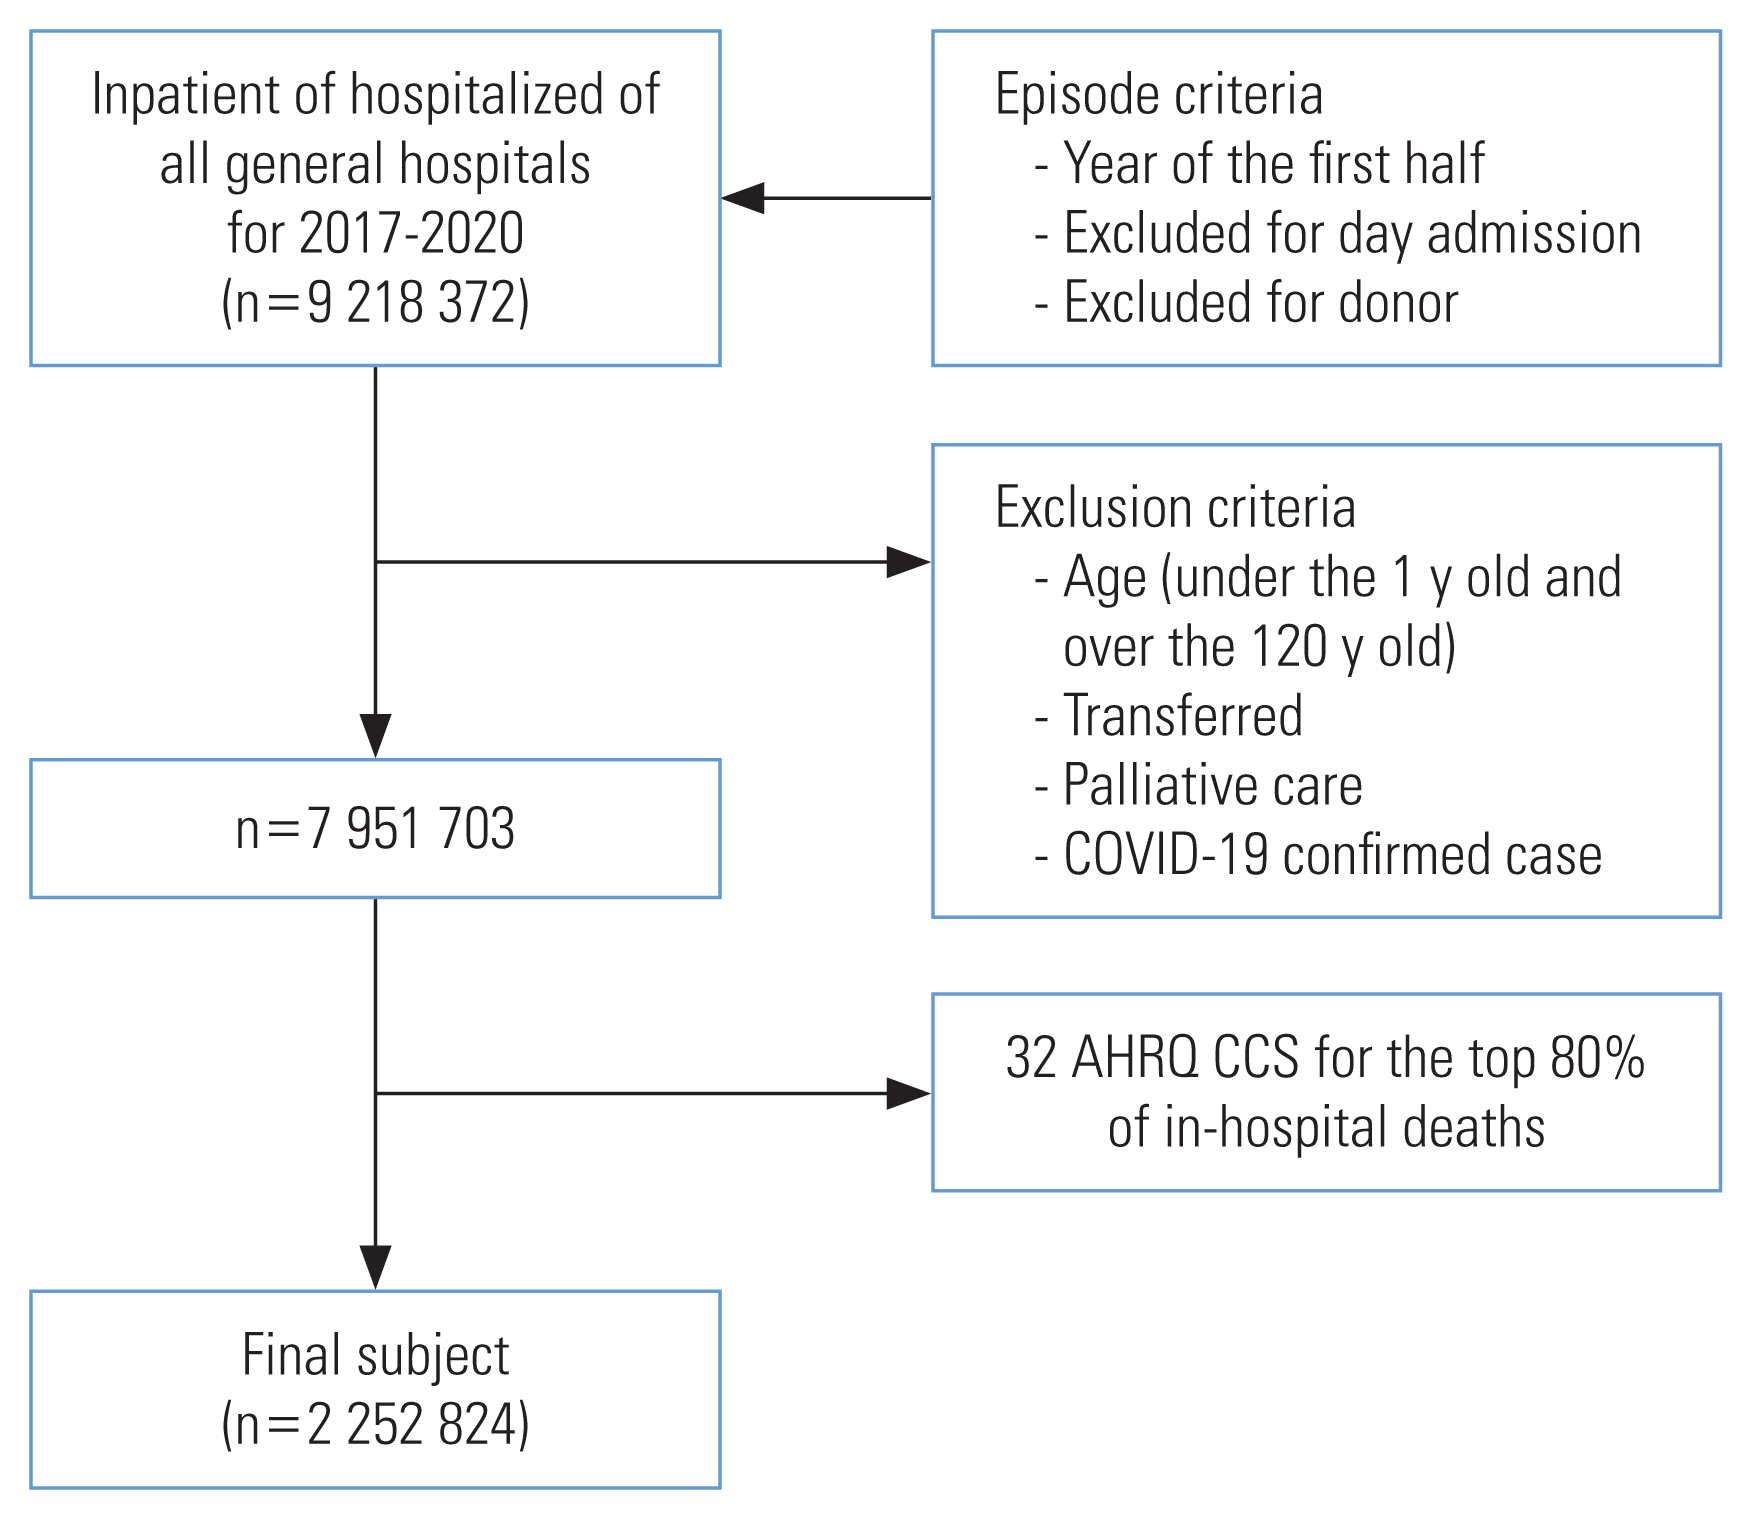
- As the analysis target period, national hospital discharge databases from January to June in 2017, 2018, and 2019 were used as patient data before the COVID-19 outbreak, and national hospital discharge databases from January to June 2020 were used as patient data after the COVID-19 outbreak. All general hospitals with more than 100 beds were selected for inclusion to increase the accuracy of the measured mortality by applying an appropriate sample size. In addition, children under the age of 1, patients over the age of 120, and cases with the same hospitalization and discharge date were also excluded. In the inpatient Korea National Health Insurance claim database, organ donors or patients in palliative care hospitals were excluded from the analysis because it would be difficult to interpret death as being directly correlated with the quality of health care in those cases. All hospitalizations transferred to other hospitals were also excluded from the analysis because it was not possible to exclude the possibility of the outcome being affected by the hospitalization services of the institution to which the patient was transferred. However, if the patient died on the day of transfer, the death was attributed to the relevant institution. For trend analysis, hospitalization cases with COVID-19-related diagnostic codes (U071, U072) were excluded from the analysis. The HSMR is the ratio of actual hospital deaths to expected hospital deaths for the most responsible diagnoses (MRDs) that accounted for 80% of inpatient mortality. Patient’s in-hospital deaths were classified according to MRD categories using the HSMR methodology, with 32 of the 258 MRDs of all inpatients accounting for 80% of all deaths in this study. These 32 MRD disease groups included acute myocardial infarction, acute cerebrovascular disease, and coronary atherosclerosis. The final analysis included 2 252 824 subjects. The process of collecting eligible data from the administrative data and selecting targeted participants is shown in Figure 1.
- The patient characteristics required for HSMR calculation were obtained from the Korean National Health Insurance claims data. Claims data include patient demographic information, such as sex, age, major diagnosis (International Statistical Classification of Diseases and Related Health Problems, 10th revision [ICD-10] code), comorbid diseases (Charlson comorbidity index, CCI), operation status, and emergency hospitalization. The CCI was calculated using the methodology of Canadian Institute for Health Information, Canada, which was developed based on Quan’s updated methodology. For the CCI, if there were diagnoses corresponding to 12 comorbid disease categories in the patient’s medical record for the past year, counting the diagnosis group only once without duplication, the CCI was calculated as the sum of the selected weights. Hospital characteristics, such as the number of hospital beds and geographic location, were also identified. For death, information from the Korea Ministry of the Interior and Safety was used.
- Hospital Standardized Mortality Rates
- The HSMR was developed in the United Kingdom in 1999 [18] and has been measured in many countries, including Canada [19] and the Netherlands [20] because it has the advantage of measuring health outcomes clearly and relatively easily [21,22]. The retrospective research design used in the current study was based on research schemes conducted in the Unite Kingdom, Canada, and the Netherlands.
- The HSMR is calculated as the ratio of expected deaths to actual deaths (multiplied by 100). For improved accuracy in estimating the number of expected deaths, the probability of death was calculated for each main diagnosis group with homogeneous characteristics. In other words, by fitting the logistic regression model for each diagnosis group, the expected mortality probability for each patient is calculated, and the mortality probability for each hospital is summed to estimate the expected number of deaths. The 2017–2019 data were set as the baseline, and changes in 2020 were evaluated. The 95% confidence interval (CI) was calculated using Byer’s approximation methodology [23]. Based on an HSMR of 100, if the upper limit of the 95% CI is <100, it could be interpreted as good quality of care, whereas a lower limit ≥100 could be interpreted as indicating poor quality of care.
- Statistical Analysis
- The outcome variable for this study was the HSMR, which represents the hospital inpatient mortality rate (the date of discharge was considered the date of death). The independent variables considered for inclusion in the models were chosen using factors available in the Korean National Health Insurance claims data. Patient characteristics, including age (categorized as 1–34, 35–49, 50–64, 65–79, and ≥80 years), sex, insurance type (e.g., national health insurance or Medical Aid), operative status (e.g., whether surgery was performed or not), admission type (e.g., emergency or elective), and the CCI (categorized as 0, 1–2, and 3) were categorized appropriately and included in the regression. In particular, to identify comorbidities, a list of all hospitalized and outpatient morbidities was screened 1 year before admission. Binomial logistic regression models across the Clinical Classifications Software groups presented the expected probability of death for each patient. We analyzed the time trend of the overall HSMR by region and hospital type and divided the regions into 2 categories (the Daegu-Gyeongbuk area and other parts of the nation) to investigate the impact of the early stages of the COVID-19 pandemic, during which a localized epidemic occurred in the Daegu-Gyeongbuk area. For variable selection, the backward elimination procedure was applied. In addition, to analyze the difference in the HSMR depending on whether an institution engaged in the COVID-19 response, medical institutions with a treatment code related to COVID-19 were designated as COVID-19 response institutions. Since there is a Korean Standard Classification of Diseases code for confirmed cases of COVID-19 infection, instances where the main diagnosis was U07.1 (the treatment code related to COVID-19) were used for this classification. All data analyses were performed using SAS version 9.3 (SAS Institute Inc., Cary, NC, USA).
- Ethics Statement
- This study was reviewed and approved by the Institutional Review Board of Health Insurance Review and Assessment Service (IRB No. 2021-012-001).
METHODS
- From 2017 to 2020, there were 563 206 admissions per year on average. There was a difference in the distribution of admission by age in all years, and there was a significant difference in survival or death by age (p<0.001). The proportion of males was higher than females in all years. Between 2017 and 2020, about a quarter of cases underwent surgery. Elective hospitalization was more frequent than hospitalization via the emergency department in all years (p<0.001). Most patients had a total CCI score of 3 or over, followed by patients with a score of 1–2 and then those with a score of 0 (Table 1).
- On a nationwide basis, the HSMR decreased in 2019 (HSMR, 97.3; 95% CI, 95.8 to 98.8) compared to 2017 (HSMR, 102.6; 95% CI, 101.0 to 104.3) and 2018 (HSMR, 100.4; 95% CI, 98.9 to 101.9) but showed a slight increase in 2020 (HSMR, 99.3; 95% CI, 97.7 to 101.0). In the Daegu-Gyeongbuk area, where many COVID-19 patients were diagnosed in early 2020, the HSMR increased significantly in 2020 (HSMR, 112.7; 95% CI, 107.0 to 118.7) compared to 2019 (HSMR, 101.7; 95% CI, 96.9 to 106.6). Nationwide, excluding the Daegu-Gyeongbuk area, the time trend in the HSMR from 2019 (HSMR, 96.8; 95% CI, 95.2 to 98.3) to 2020 (HSMR, 98.0; 95% CI, 96.3 to 99.7) showed relatively little change. In terms of hospital type, the HSMR in tertiary hospitals decreased in 2020 (HSMR, 87.1; 95% CI, 84.6 to 89.6) compared to 2019 (HSMR, 91.5; 95% CI, 89.1 to 94.0), but the HSMR in all general hospitals increased significantly in 2020 (HSMR, 106.4; 95% CI, 104.3 to 108.5) compared to 2019 (HSMR, 100.3; 95% CI, 98.4 to 102.2). Among general hospitals, the HSMR in those with fewer than 300 beds increased significantly in 2020 (HSMR, 118.0; 95% CI, 113.9 to 122.3) compared to 2019 (HSMR, 104.0; 95% CI, 100.7 to 107.5) (Table 2).
- By hospital type and region, the HSMR of all hospitals in Daegu-Gyeongbuk area increased in 2020 (HSMR, 112.7; 95% CI, 107.0 to 118.7) compared to 2019 (HSMR, 101.7; 95% CI, 96.9 to 106.6). The HSMR in tertiary hospitals tended to decrease slightly in 2020 (HSMR, 99.4; 95% CI, 90.0 to 109.5) compared to 2019 (HSMR, 102.3; 95% CI, 94.4 to 110.7), and the HSMR in all general hospitals increased more in 2020 (HSMR, 119.1; 95% CI, 111.9 to 126.5) than 2019 (HSMR, 101.3; 95% CI, 95.4 to 107.5) in the Daegu-Gyeongbuk area. Among general hospitals, there was a greater increase in those with more than 500 beds (HSMR, 124.3; 95% CI, 114.3 to 135.0 in 2020 vs. HSMR, 112.0; 95% CI, 102.9 to 121.7 in 2019) and those with fewer than 300 beds (HSMR, 117.2; 95% CI, 104.4 to 131.1 in 2020 vs. HSMR, 84.6; 95% CI, 76.1 to 93.7 in 2019). Nationwide except in the Daegu-Gyeongbuk area, the HSMR in tertiary hospitals decreased slightly between 2019 (HSMR, 90.2; 95% CI, 87.7 to 92.8) and 2020 (HSMR, 86.1; 95% CI, 83.5 to 88.7), but the HSMR in all general hospitals increased slightly in 2020 (HSMR, 105.1; 95% CI, 102.9 to 107.3) compared to 2019 (HSMR, 100.2; 95% CI, 98.2 to 102.2). Among general hospitals, the HSMR increased in 2020 compared to 2019 in general hospitals with 300–500 beds (HSMR, 107.9; 95% CI, 103.4 to 112.5 in 2020 vs. HSMR, 102.2; 95% CI, 98.4 to 106.2 in 2019) and with fewer than 300 beds (HSMR, 118.1; 95% CI, 113.8 to 122.7 in 2020 vs. HSMR, 106.8; 95% CI, 103.2 to 110.5 in 2019) (Table 3). Table 4 describes the HSMR by hospital type and COVID-19 response participation in 2020. Hospitals participating in the COVID-19 response had a lower HSMR (HSMR, 95.6; 95% CI, 93.9 to 97.4) than hospitals not participating in the COVID-19 response (HSMR, 124.3; 95% CI, 119.3 to 129.4). This tendency was similar regardless of the size of the hospital. The same tendency occurred in the Daegu-Gyeongbuk area, except for general hospitals with 300–500 beds (HSMR, 104.6; 95% CI, 99.8 to 109.5 vs. HSMR, 125.8; 95% CI, 113.8 to 138.7).
RESULTS
- This study showed the changes in the HSMR in Korean hospitals before and during the COVID-19 pandemic and presented 3 crucial findings. First, in contrast to non-pandemic areas, COVID-19 pandemic areas showed a significantly increased HSMR in 2020 compared to 2019. Second, the HSMR increased in general hospitals with a relatively small number of beds, unlike tertiary hospitals. Third, hospitals participating in the COVID-19 response tended to have a lower HSMR, regardless of the size of the hospital.
- Hospitalizations with COVID-19-related diagnostic codes were excluded from this study because the COVID-19-related mortality rate also presented various trends over time in past studies [24]. Therefore, we considered the results with the exclusion of COVID-19-related deaths. Considering that the HSMR is an indicator of inpatient care quality [17], the outbreak of COVID-19 could have affected the quality of medical care. Contrary to previous studies showing that the COVID-19 outbreak did not affect the quality of care for certain diseases [25,26], in the current study, the HSMR increased significantly in the Daegu-Gyeongbuk area (the main COVID-19 outbreak area in Korea in early 2020). This result could be interpreted in 2 ways. First, considering an earlier report that the hospitalization rate for severe diseases decreased during the COVID-19 period [27], it is possible that actual hospitalization delays or changes in the quality of care have occurred. There is a possibility that the death rate increased due to an increase in the severity of patients during the transportation process due to the unavailability of medical services or a decrease in the number of hospitals to which patients could be transported. In previous studies, treatment for patients undergoing primary percutaneous coronary intervention in the United States decreased by 38% following the COVID-19 outbreak compared to 2019 [4]. During the peak of the COVID-19 pandemic, hospitalizations for acute coronary syndrome declined in Italy and the United States [5]. The overall hospitalization rate, excluding hospitalizations due to COVID-19, also decreased [6]. In outpatient clinics, a marked decrease in radiographic examinations occurred in patients with cancer [7]. These studies pointed out that reduced treatment could lead to an increase in mortality, and it has also been reported that the rate of emergency room visits decreased during the COVID-19 period [28]. Second, there might have been an increase in reluctance to use medical institutions, even if patients had other diseases, due to fear of catching COVID-19 [8]. Avoidance of emergency departments and medical services because of concerns about becoming infected by COVID-19 has resulted in reduced rates of stroke and myocardial infarction in the emergency department [8]. but an increase in out-of-hospital cardiac arrests [29].
- Unlike tertiary hospitals, general hospitals with relatively few beds showed an increase in the HSMR during the COVID-19 pandemic in this study. The requirement to change the care process in response to COVID-19 would impose a burden on the entire hospital [30]. The quality of care may differ according to the size of the hospital, even for the same disease [31,32]. During the COVID-19 outbreak, relatively small hospitals may have experienced qualitative deficiencies in care due to shortages of staff or resources. This effect may have led to an additional increase in the HSMR in relatively small hospitals during the COVID-19 outbreak.
- Although COVID-19 has impacted the operation of most hospitals, this study also showed significant differences in changes in HSMR according to hospital type or participation in the COVID-19 response. As of January 2020, the Korean government established designated hospitals by the Korea Centers for Disease Control and Prevention (now the Korea Disease Control and Prevention Agency) that provided inpatient treatment for COVID-19 patients who needed hospitalization, or COVID-19 protection hospitals that operated clinics for respiratory patients needing medical care for other reasons [33,34]. For those hospitals participating in the COVID-19 response, additional medical personnel were necessary to maintain an adaptive healthcare system; therefore, the medical workforce was coordinated in areas of need [33,34].
- This study has several limitations. First, the HSMR methodology does not yet have standardized inclusion and exclusion criteria. Therefore, depending on the methodology applied, different results from those found in this study may be obtained. Although demographic factors, socioeconomic factors, and the narrowest variables that could reflect the severity of the disease were input in this study, the results may have depended on factors that we did not consider. Second, although the HSMR is a useful tool to explain the overall quality of hospitals, many researchers doubt whether it reflects a correlation with actual quality. Comparisons with medical record reviews found no association between avoidable deaths and HSMR outcomes [35]. It is recommended to use the HSMR only for trend analysis or monitoring; thus, caution is needed in the interpretation of these findings [21]. Third, our analysis was limited to Korea, where the population is ethnically homogeneous, and it is uncertain whether our results could be generalized to other populations. Nevertheless, this study reflects a comprehensive sample of all Korean hospitals during the COVID-19 pandemic. Finally, this study was conducted based on the database of the National Health Insurance Service. In using insurance claims-based data, we were unable to investigate processes of care that might also be relevant for assessing disparities in outcomes. Furthermore, errors may occur in the coding process for diseases. In the insurance claim process, a diagnosis code may be inserted for a drug prescription, or a claim for a diagnostic test or treatment may be included, and other coding changes may be made to prevent disqualification in the insurance review process. For this reason, the disease code may be inaccurate.
- In summary, this study revealed the possibility that the COVID-19 pandemic might have negatively impacted the quality of care in hospitals, particularly general hospitals with a relatively small number of beds. In addition, the results confirmed a difference in the quality of care between hospitals that participated in the COVID-19 response and hospitals that did not, regardless of hospital size. In light of the COVID-19 pandemic, to maintain the quality of inpatient care, it is necessary to prevent excessive workloads in hospitals and to properly employ and coordinate the workforce.
DISCUSSION
-
CONFLICT OF INTEREST
The authors have no conflicts of interest associated with the material presented in this paper.
-
FUNDING
None.
Notes
ACKNOWLEDGEMENTS
-
AUTHOR CONTRIBUTIONS
Conceptualization: Kang EK, Lee H, Lee JY, Jang WM. Data curation: Kang EK, Shin MS, Jang WM. Formal analysis: Kang EK, Lee H, Lee JY, Jang WM, Shin MS. Funding acquisition: None. Methodology: Kang EK, Lee H, Lee JY, Jang WM, Shin MS. Writing – original draft: Kang EK, Lee H, Jang WM, Shin MS. Writing – review & editing: Kang EK, Lee H, Lee JY, Jang WM, Shin MS.
Notes
- 1. Huang C, Wang Y, Li X, Ren L, Zhao J, Hu Y, et al. Clinical features of patients infected with 2019 novel coronavirus in Wuhan, China. Lancet 2020;395(10223):497-506ArticlePubMedPMC
- 2. World Health Organization. WHO coronavirus disease (COVID-19) dashboard; [cited 2020 Dec 26]. Available from: https://covid19.who.int/
- 3. Centers for Disease Control and Pevention. Healthcare facilities: managing operations during the COVID-19 pandemic; [cited 2020 Dec 22]. Available from: https://stacks.cdc.gov/view/cdc/89191
- 4. Garcia S, Albaghdadi MS, Meraj PM, Schmidt C, Garberich R, Jaffer FA, et al. Reduction in ST-segment elevation cardiac catheterization laboratory activations in the United States during COVID-19 pandemic. J Am Coll Cardiol 2020;75(22):2871-2872ArticlePubMedPMC
- 5. Huynh K. Reduced hospital admissions for ACS - more collateral damage from COVID-19. Nat Rev Cardiol 2020;17(8):453ArticlePubMedPMCPDF
- 6. Baum A, Schwartz MD. Admissions to veterans affairs hospitals for emergency conditions during the COVID-19 pandemic. JAMA 2020;324(1):96-99ArticlePubMedPMC
- 7. Quaquarini E, Saltalamacchia G, Presti D, Caldana G, Tibollo V, Malovini A, et al. Impact of COVID-19 outbreak on cancer patient care and treatment: data from an outpatient oncology clinic in Lombardy (Italy). Cancers (Basel) 2020;12(10):2941ArticlePubMedPMC
- 8. Wong LE, Hawkins JE, Langness S, Murrell KL, Iris P, Sammann A. Where are all the patients? Addressing Covid-19 fear to encourage sick patients to seek emergency care. NEJM Catal Innov Care Deliv 2020;1(3):1-12
- 9. Vestergaard LS, Nielsen J, Richter L, Schmid D, Bustos N, Braeye T, et al. Excess all-cause mortality during the COVID-19 pandemic in Europe - preliminary pooled estimates from the EuroMOMO network, March to April 2020. Euro Surveill 2020;25(26):2001214ArticlePubMedPMC
- 10. Rivera R, Rosenbaum JE, Quispe W. Excess mortality in the United States during the first three months of the COVID-19 pandemic. Epidemiol Infect 2020;148: e264ArticlePubMedPMC
- 11. Bollmann A, Hohenstein S, König S, Meier-Hellmann A, Kuhlen R, Hindricks G. In-hospital mortality in heart failure in Germany during the Covid-19 pandemic. ESC Heart Fail 2020;7: 4416-4419ArticlePubMedPMCPDF
- 12. Kontis V, Bennett JE, Rashid T, Parks RM, Pearson-Stuttard J, Guillot M, et al. Magnitude, demographics and dynamics of the effect of the first wave of the COVID-19 pandemic on all-cause mortality in 21 industrialized countries. Nat Med 2020;26(12):1919-1928ArticlePubMedPMCPDF
- 13. Petterson S, Westfall JM, Miller BF. Projected deaths of despair from COVID-19; 2020 [cited 2020 Dec 26]. Available from: https://digitalcommons.psjhealth.org/publications/3054
- 14. Kiang MV, Irizarry RA, Buckee CO, Balsari S. Every body counts: measuring mortality from the covid-19 pandemic. Ann Intern Med 2020;173(12):1004-1007ArticlePubMedPMC
- 15. Hill K, Lopez AD, Shibuya K, Jha P; Monitoring of Vital Events (MoVE). Interim measures for meeting needs for health sector data: births, deaths, and causes of death. Lancet 2007;370(9600):1726-1735ArticlePubMed
- 16. Mohammed MA, Deeks JJ, Girling A, Rudge G, Carmalt M, Stevens AJ, et al. Evidence of methodological bias in hospital standardised mortality ratios: retrospective database study of English hospitals. BMJ 2009;338: b780ArticlePubMedPMC
- 17. Pitches DW, Mohammed MA, Lilford RJ. What is the empirical evidence that hospitals with higher-risk adjusted mortality rates provide poorer quality care? A systematic review of the literature. BMC Health Serv Res 2007;7: 91ArticlePubMedPMCPDF
- 18. Jarman B, Gault S, Alves B, Hider A, Dolan S, Cook A, et al. Explaining differences in English hospital death rates using routinely collected data. BMJ 1999;318(7197):1515-1520ArticlePubMedPMC
- 19. Baker GR, Norton PG, Flintoft V, Blais R, Brown A, Cox J, et al. The Canadian Adverse Events Study: the incidence of adverse events among hospital patients in Canada. CMAJ 2004;170(11):1678-1686ArticlePubMedPMC
- 20. Zegers M, de Bruijne MC, Wagner C, Hoonhout LH, Waaijman R, Smits M, et al. Adverse events and potentially preventable deaths in Dutch hospitals: results of a retrospective patient record review study. Qual Saf Health Care 2009;18(4):297-302ArticlePubMed
- 21. Bottle A, Jarman B, Aylin P. Strengths and weaknesses of hospital standardised mortality ratios. BMJ 2010;342: c7116ArticlePubMed
- 22. Vincent C, Neale G, Woloshynowych M. Adverse events in British hospitals: preliminary retrospective record review. BMJ 2001;322(7285):517-519ArticlePubMedPMC
- 23. Canadian Institute for Health Information. Hospital standardized mortality ratio (HSMR); 2016 [cited 2020 Dec 26]. Available from: https://www.cihi.ca/en/hospital-standardized-mortality-ratio-hsmr
- 24. Roth GA, Emmons-Bell S, Alger HM, Bradley SM, Das SR, de Lemos JA, et al. Trends in patient characteristics and COVID-19 in-hospital mortality in the United States during the COVID-19 pandemic. JAMA Netw Open 2021;4(5):e218828ArticlePubMedPMC
- 25. Rinkel LA, Prick JC, Slot RE, Sombroek NM, Burggraaff J, Groot AE, et al. Impact of the COVID-19 outbreak on acute stroke care. J Neurol 2021;268(2):403-408ArticlePubMedPMCPDF
- 26. Tam CF, Cheung KS, Lam S, Wong A, Yung A, Sze M, et al. Impact of coronavirus disease 2019 (COVID-19) outbreak on ST-segment-elevation myocardial infarction care in Hong Kong, China. Circ Cardiovasc Qual Outcomes 2020;13(4):e006631ArticlePubMedPMC
- 27. De Filippo O, D’Ascenzo F, Angelini F, Bocchino PP, Conrotto F, Saglietto A, et al. Reduced rate of hospital admissions for ACS during Covid-19 outbreak in Northern Italy. N Engl J Med 2020;383(1):88-89ArticlePubMedPMC
- 28. Lazzerini M, Barbi E, Apicella A, Marchetti F, Cardinale F, Trobia G. Delayed access or provision of care in Italy resulting from fear of COVID-19. Lancet Child Adolesc Health 2020;4(5):e10-e11ArticlePubMedPMC
- 29. Marijon E, Karam N, Jost D, Perrot D, Frattini B, Derkenne C, et al. Out-of-hospital cardiac arrest during the COVID-19 pandemic in Paris, France: a population-based, observational study. Lancet Public Health 2020;5(8):e437-e443ArticlePubMedPMC
- 30. Priori A, Baisi A, Banderali G, Biglioli F, Bulfamante G, Canevini MP, et al. The many faces of covid-19 at a glance: a university hospital multidisciplinary account from Milan, Italy. Front Public Health 2021;8: 575029ArticlePubMedPMC
- 31. Silvera GA. The moderating role of hospital size on the relationship between patient experience and patient safety. Qual Manag Health Care 2017;26(4):210-217ArticlePubMed
- 32. Hirji SA, Shah RM, Fields A, Orhurhu V, Bhulani N, White A, et al. The impact of hospital size on national trends and outcomes following open esophagectomy. Medicina (Kaunas) 2019;55(10):669ArticlePubMedPMC
- 33. You J. Lessons from South Korea’s Covid-19 policy response. Am Rev Public Adm 2020;50(6–7):801-808ArticlePDF
- 34. Lee Y, Yang M. The politics of the pandemic in South Korea. Taiwan J Democr 2020;16(2):57-77
- 35. Hogan H, Zipfel R, Neuburger J, Hutchings A, Darzi A, Black N. Avoidability of hospital deaths and association with hospital-wide mortality ratios: retrospective case record review and regression analysis. BMJ 2015;351: h3239ArticlePubMedPMC
 PubReader
 ePub Link
 Cite
Cite