
Articles
- Page Path
- HOME > J Prev Med Public Health > Volume 56(1); 2023 > Article
-
Original Article
Factors Influencing Suicidal Ideation According to the Deprivation Indices of Different Regions in Korea -
Yun-Young Kim
 , Hyung-Joo Park
 -
Journal of Preventive Medicine and Public Health 2023;56(1):88-94.
DOI: https://doi.org/10.3961/jpmph.22.356
Published online: January 31, 2023
Department of Social Welfare, Jeonbuk National University, Jeonju, Korea
- Corresponding author: Hyung-Joo Park, Department of Social Welfare, Jeonbuk National University, 567 Baekje-daero, Deokjin-gu, Jeonju 54896, Korea E-mail: phj7330@jbnu.ac.kr
Copyright © 2023 The Korean Society for Preventive Medicine
This is an Open Access article distributed under the terms of the Creative Commons Attribution Non-Commercial License (http://creativecommons.org/licenses/by-nc/4.0/) which permits unrestricted non-commercial use, distribution, and reproduction in any medium, provided the original work is properly cited.
ABSTRACT
-
Objectives
- This study examined how deprivation differed by region and the effect those differences had on suicidal ideation among the local population.
-
Methods
- Data collected over 10 years (2012-2021) in the Korea Welfare Panel Study were organized into 3 categories: metropolitan, city, and rural. A panel analysis was conducted on the impact of deprivation indices, socio-demographic characteristics, and life satisfaction on suicidal ideation in each category.
-
Results
- Income, divorce status, family relationship satisfaction, and medical deprivation had a significant impact on suicidal ideation in metropolitan areas, whereas these variables did not have significant effects in rural areas. In other words, income, family, and medical support were more impactful in city areas.
-
Conclusions
- Although the deprivation index was higher in rural areas than in city areas due to an aging population and reduced income levels, the mental health of rural residents was found to be generally better than that of city residents. The possibility that this is related to the strength of relationships within the respective communities should be considered in light of recent discussions on relational welfare.
- Previous research [1] defined “deprivation” as a state wherein there is an absence of goods, services, and resources. Deprivation indicates social and economic deficiencies within a community, which can vary by region and residential environment [2]. Consequently, deprivation indices have been created to classify the socioeconomic level of a region by indexing its levels of deprivation and deficiency. For example, since the 1970s, the Department for Communities and Local Governments in the United Kingdom has calculated regional deprivation indices and used them to develop policies that allocate public resources to relatively underdeveloped regions [3]. Based on those indices, the Index for Multiple Deprivation was published in 2000. Australia and New Zealand also use these deprivation indices for their respective regional policies [4]. Furthermore, previous studies [4,5] reported correlations between city size and income inequality, while related research [6] found that people living in regions with high income inequality had a greater sense of relative deprivation.
- In general, deprivation is a serious social problem. Beyond material scarcity, it can undermine an individual’s mental health and lead to extreme results such as suicide [7,8]. Meanwhile, the coronavirus disease 2019 (COVID-19) pandemic accelerated global deprivation levels and seriously affected the mental health of people worldwide [9].
- Levels of deprivation are influenced by regional characteristics such as local culture, economic status, and employment opportunities [10,11]. Deprivation has been reported to be greater for people living in areas with high income inequality [6], and significant differences in deprivation levels have been found according to area of residence and environment [2].
- Deprivation is closely related to mental health [7] and is a strong explanatory factor in predicting depression and suicide [8,12]. Since deprivation affects several areas of mental health, it was possible for this study to examine the direct relationship between deprivation and suicide according to regional characteristics.
- Using deprivation indices, the present study examined the mental health of residents in metropolitan, city, and rural areas of Korea. We first analyzed the levels of deprivation and the annual mental health trends by region, then used panel analysis to determine the effect of the deprivation indices in each region on the mental health of its residents. This report also provides recommendations for designing policies based on the regional characteristics of metropolitan, city, and rural areas in Korea.
INTRODUCTION
- Analysis Data and Research Subjects
- This study used data collected over 10 years (from wave 7 [2012] to wave 16 [2021]) in the Korea Welfare Panel Study (KoWePS), which was conducted by the Korea Institute for Health and Social Affairs. The purpose of the KoWePS is to dynamically report changes in the status of the poor, the working poor, and the low-income class as the economic environment evolves. The panel is a national survey that collects data on the living status of various population groups according to age, income class, and economic activity. Thus, it is suitable for examining the regional differences in individual deprivation indices and levels of suicidal ideation. Our analysis of panel data began with wave 7 (2012) because new samples were introduced that year that included suicide-related questions.
- Variable Composition and Measurement
- This study chose suicidal ideation as a proxy indicator of mental health, since it is easier to track its progression than depression. The KoWePS measures suicidal behavior by an item that asks whether an individual has seriously considered suicide during the year. In the present study, this item was defined as the suicidal ideation variable and analyzed.
- Independent variable: deprivation index
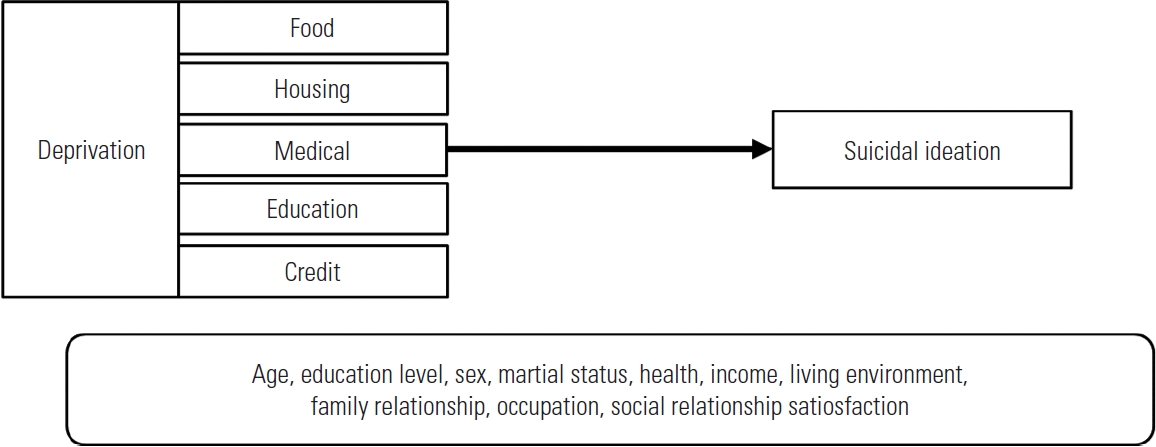
- In the KoWePS questionnaire, the experience of material deprivation was measured by dividing it into the following 5 areas suggested by Townsend [1]: food deprivation (5 items), housing deprivation (2 items), medical deprivation (2 items), education deprivation (1 item), and credit deprivation (1 item). Food deprivation was measured using a 4-point scale (often, sometimes, not at all, or I do not know/prefer not to say), while housing deprivation, medical deprivation, education deprivation, and credit deprivation each used a 3-point scale (yes, no, does not apply). In this study, participants who responded “often or sometimes” to food deprivation were coded as 1, “not at all” was coded as 0, and “does not know” was coded as missing. For the rest of the deprivation, ‘yes’ and ‘no’ were marked as 1 and 0 respectively while “does not apply” was coded as missing. Overall, responding to 1 means have experienced deprivation, while responding to 0 means haven’t.
- Based on previous research, this study conducted a panel analysis to determine how the deprivation indices (depending on region) were associated with suicidal ideation, while controlling for socio-demographic factors such as age, education level, sex, marital status, and occupation. In previous empirical studies, female, those with low education levels, and those who were unmarried and/or unemployed were more prone to suicide than their counterparts [9,13].
- The composition of variables and the research model are shown in Table 1 and Figure 1.
- Method of Analysis
- This study first examined the change patterns of regional differences in the relationship of individual deprivation indices to levels of suicidal ideation. Next, panel data were constructed, and a panel analysis was performed to examine the effect of the deprivation indices on suicidal ideation by region.
- Non-linear models (e.g., logit or probit) are typically used when the dependent variable is a binary variable. However, a linear regression model has also been utilized to directly calculate the regression coefficient in earlier works [13-15], and this method was used in the present study.
- There are advantages to conducting a panel analysis. First, it can examine the dynamic trends among variables. Second, model misspecifications can be reduced because a panel analysis reflects the heterogeneity of subjects, such as individuals, families, and regions. Third, efficient estimators can be obtained since this method provides more information and variability than cross-series and time-series data. Finally, the multicollinearity problem can be alleviated by reducing the possibility of linear relationships between independent variables [16,17]. This study used KoWePS sampling from wave 7 (2012) to wave 16 (2021). Panel analysis was performed on a total of 157 760 cases over a 10-year period, with 66 358 people in large cities, 61 986 people in small cities, and 29 416 people in rural areas. As previously stated, the estimator bias was reduced because there was variation over time and the population analyzed averaged 15 000 people per year.
- The advantages of this study included: (1) calculating the deprivation indices through panel analysis, (2) measuring changes in these indices over time, (3) reducing the deviation of omitted variables, and (4) being relatively free from multicollinearity problems regarding deprivation indices and suicidal ideation. Therefore, the present study effectively examined the mental health of residents according to the impact of deprivation indices in metropolitan, city, and rural areas of Korea.
- Ethics Statement
- This article does not contain any studies with human participants performed by any of the authors.
METHODS
Dependent variable: suicidal ideation
Control variable: socio-demographic factors
- The trend of time-series changes by location (metropolitan, city, and rural areas) from 2012 to 2021 are presented in Table 2. The 10-year survey sample was 157 760 people, with the largest category from metropolitan areas (42%). Although sample decreases can be observed in all 3 areas, the KoWePS showed a good panel retention rate of 70-80%. In addition, the KoWePS provides suitable data for low-income sample research and deprivation index surveys because the sample consisted of approximately 50% low-income families [18].
- Trends in the deprivation indices and the levels of suicidal ideation by region are shown in Table 3. The deprivation indices generally decreased in all areas over time. Although this is related to the panel retention rate mentioned earlier, it is also evidence that support for low-income families is improving. Looking at overall trends, deprivation indices were highest in the areas of food, credit, housing, medical access, and education. Most of the deprivation indices (food, medical, education, and credit) were highest in metropolitan areas, while the housing deprivation index was highest in city areas.
- Like the deprivation indices, suicidal ideation was found to be the highest in metropolitan areas, followed by city and rural areas. Comparing before and after 2020, when COVID-19 fully emerged, metropolitan areas showed a slight decrease in suicidal ideation after the pandemic, with a slight increase in city and rural areas. This phenomenon probably occurred because there was a period of national unity and a spread of positive emotions in the early days of the pandemic [19]. This may be an over-interpretation, but a similar phenomenon was seen after the East Japan earthquake in 2011 when positive emotions initially spread from a sense of national unity [20].
- Results of the panel analysis using a probability effect model to examine the effect of the deprivation indices on suicidal ideation by region are presented in Table 4. Specifically, when the panel analysis results were examined by region, income and volunteer experience had a significant impact on suicidal ideation in metropolitan areas, while income, age, and divorce had an impact in city areas. In rural areas, there were no sociodemographic variables that had a statistically significant impact on suicidal ideation.
- Next, looking at the effect of life satisfaction on suicidal ideation, it was found that high degrees of health and social relationship satisfaction indicated significant negative trends in suicidal ideation in metropolitan, city, and rural areas. In addition, family relationship satisfaction had an impact on the decrease in suicidal ideation in metropolitan and city areas. It was only in metropolitan areas that income and job satisfaction had a statistically significant impact on suicidal ideation.
- Finally, in all 3 categories, housing and credit deprivation showed associations with high suicidal ideation. Moreover, food and medical deprivation were factors that increased suicidal ideation in metropolitan and city areas, while credit deprivation increased suicidal ideation in city and rural areas.
RESULTS
- In this study, we classified 10 years of data (2012-2021) from the KoWePS into 3 categories (metropolitan, city, and rural), and conducted a panel analysis of the impact of deprivation indices, socio-demographic characteristics, and life satisfaction on suicidal ideation in each regional category.
- Our analysis showed that income, divorce status, family relationship satisfaction, and medical deprivation had a significant impact on suicidal ideation in metropolitan areas, whereas these variables were not significant in rural areas. In other words, income, family, and medical support were more significant in city areas. Some studies [4-6] have found that the level of economic and relative deprivation depended on city size. In this study, health and social relationship satisfaction and housing deprivation had an impact on suicidal ideation in all 3 regions. Although the deprivation indices were worse in rural areas than in city areas, suicidal ideation was lower in rural areas than in city areas.
- Residents in rural areas often deal with issues of aging and income reduction due to a lack of jobs. However, the mental health of rural residents is generally better than that of city residents, possibly due to good relationships and involvement in their respective communities. This should be explored, considering the recent interest in relational welfare [21].
- Although the deprivation index was higher in rural areas than in city areas, suicidal ideation was lower in this study. According to Wilkinson’s psychosocial environment theory [22], the suicidal ideation of older adults is low in rural areas when there is low income inequality.
- In rural areas, local communities are relatively well developed and provide support to their residents. As a result, the conversation on relational welfare, which goes beyond the simple provision of welfare benefits to focus on greater social cohesion, is growing [4].
- Thus, this paper recommends measures to support social welfare practices. First, because the absolute values of deprivation indices and the factors influencing mental health differ by region, it is necessary for Korea to calculate regionally comprehensive deprivation indices for use in policy designs, as has been done in the United Kingdom and Australia. Regional differences also indicate that it is difficult to separate citizens’ mental health from environmental factors.
- Second, although the absolute income level was higher in city areas than in rural areas, city areas were more vulnerable to the risk of suicide, due to higher income and health inequality. Based on Wilkinson’s psychosocial environment theory, relative income status is directly related to adult health [22].
- Finally, those working in regional community centers, regional welfare centers, mental health centers, and suicide prevention centers should be aware of the connection between deprivation indices and suicidal behaviors and respond accordingly. Strengthening protective factors can reduce the influence of risk factors, while attenuating protective factors can increase that influence [23]. Moreover, as vulnerable populations with social or material deprivation are linked to social problems beyond physical and mental health problems [24], policies tailored to regional characteristics should be considered to alleviate such deprivation.
DISCUSSION
-
CONFLICT OF INTEREST
The authors have no conflicts of interest associated with the material presented in this paper.
-
FUNDING
This research was supported by National University Development Project at Jeonbuk National University in 2021.
-
AUTHOR CONTRIBUTIONS
Both authors contributed equally to conceiving the study, analyzing the data, and writing this paper.
Notes
ACKNOWLEDGEMENTS
| Variables | Total | Metropolis | City | Rural |
|---|---|---|---|---|
| Income (log) | -0.018 (0.00)** | -0.014 (0.01)** | -0.028 (0.01)** | 0.010 (0.01) |
| Debt | -3.180 (0.00) | -0.001 (0.00) | 0.003 (0.00) | -0.005 (0.00) |
| Education | -0.005 (0.00)† | -0.003 (0.00) | -0.007 (0.00) | -0.014 (0.01) |
| Volunteer experience | -0.014 (0.01)** | -0.024 (0.01)** | -0.002 (0.01) | -0.005 (0.02) |
| Sex (Ref: male) | 0.001 (0.00) | -0.006 (0.01) | 0.011 (0.01)† | -0.010 (0.01) |
| Age | -0.001 (0.00)** | -0.000 (0.00) | -0.001 (0.00)** | 0.000 (0.00) |
| Bereaved (Ref: married) | 0.008 (0.01) | 0.004 (0.01) | 0.015 (0.01) | 0.018 (0.02) |
| Divorced (Ref: married) | -0.018 (0.01)** | -0.014 (0.01)† | -0.027 (0.01)** | -0.014 (0.02) |
| Family member | -0.003 (0.00) | -0.004 (0.00) | -0.002 (0.00) | 0.004 (0.01) |
| Health satisfaction | -0.027 (0.00)** | -0.024 (0.00)** | -0.031 (0.00)** | -0.026 (0.01)** |
| Income satisfaction | -0.005 (0.00)* | -0.007 (0.00)* | -0.001 (0.00) | -0.010 (0.01) |
| Living environment satisfaction | 0.000 (0.00) | -0.001 (0.00) | 0.002 (0.00) | 0.001 (0.01) |
| Family relationship satisfaction | -0.021 (0.00)** | -0.026 (0.00)** | -0.021 (0.00)** | -0.003 (0.01) |
| Occupation satisfaction | -0.008 (0.00)** | -0.010 (0.00)** | -0.006 (0.00) | 0.000 (0.01) |
| Social relationship satisfaction | -0.010 (0.00)** | -0.008 (0.00)* | -0.011 (0.00)* | -0.041 (0.01)** |
| Food deprivation (Ref: no) | 0.000 (0.00)** | 0.000 (0.00)** | 0.000 (0.00)* | 0.000 (0.00) |
| Housing deprivation (Ref: no) | 0.001 (0.00)** | 0.000 (0.00)* | 0.001 (0.00)** | 0.001 (0.00)** |
| Medical deprivation (Ref: no) | 0.001 (0.00)** | 0.001 (0.00)** | 0.000 (0.00)† | 0.000 (0.00) |
| Education deprivation (Ref: no) | 0.001 (0.00)** | 0.001 (0.00)** | 0.000 (0.00)* | 0.001 (0.00)** |
| Credit deprivation (Ref: no) | 0.000 (0.00)** | 0.000 (0.00) | 0.000 (0.00)** | 0.000 (0.00)† |
| Constant | 0.499 (0.03)** | 0.499 (0.05)** | 0.556 (0.05)** | 0.279 (0.12)* |
| Observations | 16 288 | 8601 | 6485 | 1202 |
| No. of personal ID | 5017 | 2713 | 2192 | 460 |
- 1. Townsend P. Deprivation. J Soc Policy 1987;16(2):125-146Article
- 2. Salmond C, Crampton P, King P, Waldegrave C. NZiDep: a New Zealand index of socioeconomic deprivation for individuals. Soc Sci Med 2006;62(6):1474-1485ArticlePubMed
- 3. Ministry of Housing, Communities & Local Government. National statistics: English indices of deprivation 2015 [cited 2022 Aug 1]. Available from: https://www.gov.uk/government/statistics/english-indices-of-deprivation-2015
- 4. Cottam H. Relational welfare. Soundings 2011;48(48):134-144Article
- 5. Hyland P, Shevlin M, McBride O, Murphy J, Karatzias T, Bentall RP, et al. Anxiety and depression in the Republic of Ireland during the COVID-19 pandemic. Acta Psychiatr Scand 2020;142(3):249-256ArticlePubMedPDF
- 6. Marmot M, Wilkinson RG. Psychosocial and material pathways in the relation between income and health: a response to Lynch et al. BMJ 2001;322(7296):1233-1236ArticlePubMedPMC
- 7. Wilkinson RG, Pickett KE. The problems of relative deprivation: why some societies do better than others. Soc Sci Med 2007;65(9):1965-1978ArticlePubMed
- 8. Hawton K, Casañas I, Comabella C, Haw C, Saunders K. Risk factors for suicide in individuals with depression: a systematic review. J Affect Disord 2013;147(1-3):17-28ArticlePubMed
- 9. Ministry of Health and Welfare. COVID-19 national mental health survey in 2021. Sejong: Ministry of Health and Welfare; 2021. p. 69-85 (Korean)
- 10. Beeghley L. Individual and structural explanations of poverty. Popul Res Policy Rev 1988;7(3):201-222ArticlePDF
- 11. Massey DS, Denton NA. Trends in the residential segregation of Blacks, Hispanics, and Asians: 1970-1980. Am Sociol Rev 1987;52(6):802-825Article
- 12. Klerman GL. Clinical epidemiology of suicide. J Clin Psychiatry 1987;48 Suppl: 33-38PubMed
- 13. Yum SO, Moon JW. The effect of socioeconomic deprivation experiences of middle and old age group on depression: focusing on mediating effect of family conflict. Korean J Care Manag 2017;25: 53-76. (Korean)
- 14. Gomila R. Logistic or linear? Estimating causal effects of experimental treatments on binary outcomes using regression analysis. J Exp Psychol Gen 2021;150(4):700-709ArticlePubMed
- 15. Choi M, Lim J, Chang SS, Hwang M, Kim CS, Ki M. Financial hardship and suicide ideation: age and gender difference in a Korean panel study. J Affect Disord 2021;294: 889-896ArticlePubMed
- 16. Castells-Quintana D, Royuela V, Veneri P. Inequality and city size: an analysis for OECD functional urban areas. Pap Reg Sci 2020;99(4):1045-1064ArticlePDF
- 17. Kim YY, Choi YJ. Does social protection crowd out social investment? Policy Soc 2020;39(2):208-225Article
- 18. Korea Institute for Health and Social Affairs. Korea Welfare Panel Study: user’s guide for the 16th year [cited 2023 Jan 18]. Available from: https://www.koweps.re.kr:442/data/guide/list.do (Korean)
- 19. Kim YY, Jeon YH, Kim BY. The deprivation index, suicidal ideation, and social service innovation measures for the elderly in the COVID-19 era. 2021 Social Welfare Joint Academic Conference Materials. 2021. p. 119-136 (Korean)
- 20. Baek JW. COVID-19 and Korea’s suicide prevention measures. 2020 [cited 2022 Aug 1]. Available from: http://www.mohw.go.kr/react/al/sal0301vw.jsp?PAR_MENU_ID=04&MENU_ID=0403&CONT_SEQ=359730&page=1 (Korean)
- 21. Glaeser EL, Resseger M, Tobio K. Inequality in cities. J Reg Sci 2009;49(4):617-646Article
- 22. Wilkinson RG. Unhealthy societies: the afflictions of inequality. 1st ed. London: Routledge; 1996. p. 72-75
- 23. Masten AS. Ordinary magic. Resilience processes in development. Am Psychol 2001;56(3):227-238ArticlePubMed
- 24. Wilkinson RG. The impact of inequality: how to make sick societies healthier. London: Routledge; 2005. p. 33-38
REFERENCES
Figure & Data
References
Citations
- Factors of Capital on Depression in Older Adulthood: A Comparison of Urban and Rural Regions in Korea
MinYoung Bae, YunYoung Kim, Ijin Hong
Healthcare.2023; 11(21): 2850. CrossRef
 PubReader
 ePub Link
 Cite
Cite

