Articles
- Page Path
- HOME > J Prev Med Public Health > Volume 55(6); 2022 > Article
-
Original Article
The Relationship Between Thiamine Intake and Long Sleep Duration: Results From the Korea National Health and Nutrition Examination Survey -
Dongkyu Lee1
 , Kwanghyun Kim1,2, Youngrong Lee1, Kyungwon Oh3, Sun Jae Jung1,2
 -
Journal of Preventive Medicine and Public Health 2022;55(6):520-528.
DOI: https://doi.org/10.3961/jpmph.22.313
Published online: October 14, 2022
1Department of Preventive Medicine, Yonsei University College of Medicine, Seoul, Korea
2Department of Public Health, Yonsei University Graduate School, Seoul, Korea
3Division of Health and Nutrition Survey, Korea Disease Control and Prevention Agency, Cheongju, Korea
- Corresponding author: Sun Jae Jung, Department of Preventive Medicine, Yonsei University College of Medicine, 50-1 Yonsei-ro, Seodaemun-gu, Seoul 03722, Korea E-mail: sunjaejung@yuhs.ac
Copyright © 2022 The Korean Society for Preventive Medicine
This is an Open Access article distributed under the terms of the Creative Commons Attribution Non-Commercial License (http://creativecommons.org/licenses/by-nc/4.0/) which permits unrestricted non-commercial use, distribution, and reproduction in any medium, provided the original work is properly cited.
ABSTRACT
-
Objectives:
- Thiamine is thought to modify sleeping patterns, while alcohol use diminishes internal thiamine levels. We investigated the association between thiamine intake and sleep duration and explored possible heterogeneity in the effect according to alcohol use.
-
Methods:
- In total, 15 384 participants aged 19-64 were obtained from the Korea National Health and Nutrition Examination Survey 2012-2016. Nutrient intake, including thiamine, was measured using a food frequency questionnaire. Sleep duration was measured by a self-reported questionnaire. The highest thiamine intake quartile was set as the reference group. Participants were divided into 3 groups, with 7-8 hours of daily sleep as a reference group and those who slept more or less than that as “oversleeping” and “insufficient sleeping,” respectively. Multivariate logistic regression was used, adjusting for socioeconomic, medical, and nutritional factors. Additionally, participants were stratified according to high-risk alcohol use defined by the World Health Organization standards on alcohol use.
-
Results:
- Low thiamine intake was associated with oversleeping (Q3: odds ratio [OR], 1.06; 95% confidence interval [CI], 0.86 to 1.32; Q2: OR, 1.24; 95% CI, 0.99 to 1.55; Q1: OR, 1.49; 95% CI, 1.16 to 1.91) and showed a significant trend for higher ORs at lower intake levels (p-trend<0.001). The effect was stronger in the high-risk alcohol use group (Q1: OR, 1.78; 95% CI, 1.28 to 2.49).
-
Conclusions:
- Low thiamine intake was associated with oversleeping, and alcohol use intensified that association. These results were found in a context where overt clinical symptoms due to thiamine deficiency are considered rare. More awareness of the potential relationship of thiamine intake with oversleeping and its related risks should be considered.
- Excessive sleepers may be at a higher risk for increased morbidity and mortality. Meta-analyses have shown higher overall mortality [1] and disease-specific mortality, such as cardiovascular and cancer-related mortality [2], among long sleepers. Cohort studies support the relationship between long sleeping and mortality risk in long sleeping groups even after adjusting for physical [3,4] and psychological [5] comorbidities, showing that long sleeping is not simply a result of worsened health.
- Thiamine is an essential co-enzyme of the Krebs cycle. Daily intake of around 0.1 mg/1000 kcal or less causes overt clinical problems such as beriberi [6]. Current guidelines suggest a minimum intake around 1 mg/day [6,7]. While thiamine is abundant in crops such as wheat and rice, milling substantially decreases its concentration [8]. Therefore, severe thiamine deficiency is rare and limited to developing countries where milled crops are a cheap source of food [8,9]. However, concerns about marginal thiamine deficiency in food-secure environments have been raised [8]. Individual observational studies have reported proportions of marginal thiamine deficiency from 5.1% in adolescents [10], to 31% in the hospitalised elderly [11]. Similarly, in Korea, 38.4% of the adult population reported thiamine consumption lower than the estimated average requirement levels in 2020 [12].
- Meanwhile, thiamine deficiency has been suggested to be related to fatigue and sleep disturbances, even at early stages [13]. Animal experiments showed increased sleep duration measured by an electroencephalogram and recovery time after induced narcosis [14]. Another study showed altered sleeping patterns such as decreased wakefulness [15]. Experimental studies on populations with marginal thiamine deficiency showed that thiamine supplementation reversed fatigue, while trends for sleep pattern improvement and reduced daytime sleep time were also observed [16,17]. However, not much is known about the psychiatric consequences of marginal thiamine deficiency, while real-world epidemiologic evidence is lacking. The results of previous exploratory studies are limited and inconsistent with regard to the relationship between thiamine intake and excessive sleep [18-20].
- A harmful behaviour that disrupts thiamine metabolism is the overuse of alcohol [21]. Prolonged thiamine deficiency, caused by alcohol overuse, is a known cause of several neuropsychiatric disorders [22] and irreversible brain damage [21]. However, little is known about the moderating role of alcohol in the relationship between thiamine deficiency and sleep-related disorders. Therefore, we investigated the relationship between low intake of thiamine and sleeping duration in a food-secure environment and examined whether the thiamine-sleep relationship shows heterogeneity according to alcohol use.
INTRODUCTION
- Data Source
- The Korea National Health and Nutrition Examination Survey (KNHANES), a national cross-sectional survey that has been conducted since 1998 to evaluate the general health status, chronic disease prevalence, and the dietary and nutritional status of the Korean population, is conducted yearly by the Korea Disease Control and Prevention Agency [23]. Participants are sampled by a multi-stage clustered probability design, and the dataset is weighted to ensure generalisability to the general population [23]. Information on socioeconomic status, health behaviours, and comorbidities are obtained through systematic interviews by trained interviewers. Physical examinations, including weight and height, and nutrition surveys, such as a food frequency questionnaire (FFQ), are also included.
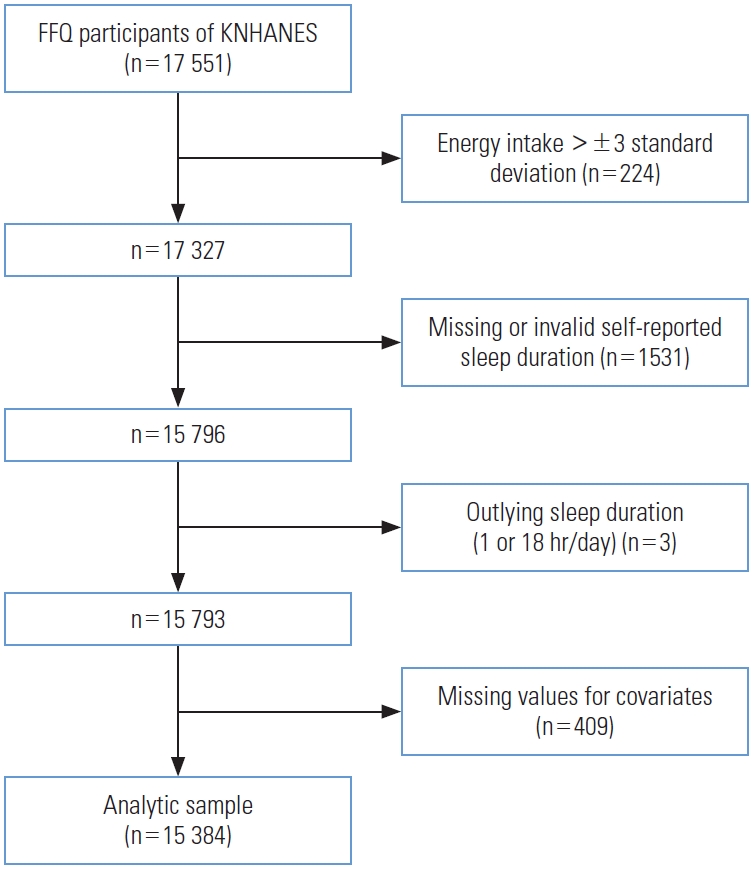
- The present study was based on data from 2012 to 2016, when the FFQ was implemented in the KNHANES. Data for 17 551 participants who participated in the FFQ were obtained from the database. The FFQ was administered to participants aged between 19 years and 64 years. In total, 2167 participants were excluded from the original dataset. Participants with energy intake greater than ±3 standard deviations from the mean (n=224, remaining=17 327) were excluded. Then those with missing or invalid self-reported sleep duration (n=1531, remaining=15 796) and outlying sleep duration reported as ≤1 hour/≥18 hours of sleep (n=3, remaining=15 793), were also excluded. Finally, participants with missing values for selected covariates were excluded (n=409). The analytic sample eventually included 15 384 participants (Figure 1).
- Exposure (Thiamine Intake)
- Data on the types and frequencies of food consumption were obtained from the FFQ, and then nutrient intake was calculated based on the national food composition table developed by the Korean National Academy of Agricultural Science [24]. This version of the FFQ and calculation method has been validated to represent the Korean population [24]. The dietary variables included in the KNHANES were total energy intake, energy-yielding nutrients (carbohydrates, protein, fat), and other nutrients (vitamins, fibre, and minerals). Vitamin B1 intake was adjusted for nutrient density per energy intake. The energy-adjusted vitamin B1 intake levels were divided into quartiles (Q), ranging from Q1 (<25th percentile [p]) to Q4 (>75p).
- Outcome (Sleep Duration)
- Sleep duration was assessed by self-report questionnaires. Between 2012-2015, daily sleep duration was surveyed through the question, “How many hours do you sleep a day?” In 2016, sleep duration on weekdays (or working days) and weekends (or holidays) was calculated by asking when the participants usually woke up and went to sleep. To combine these data, the weighted mean was calculated as the average number of weekday and weekend sleeping hours based on a 5:2 ratio [25]. Sleep duration was categorised as “normal sleep” (7-8 hr/night), “insufficient sleep” (<7 hr/night), and “oversleeping” (>8 hr/night) in accordance with previous epidemiological and experimental research describing normal sleep duration [18,26].
- Moderator (High-risk Alcohol Intake)
- Alcohol is hypothesised to be an effect moderator in the relationship between low thiamine and oversleeping given its role in the metabolism of thiamine [21] and the development of neuropsychiatric diseases [22]. The KNHANES defines high-risk alcohol use as drinking 7 or more standard drinks a day for males (or 5 or more standard drinks a day for females), and drinking twice or more a week, based on the recommendations set by the World Health Organization (WHO) [27].
- Covariates
- Age, sex, socioeconomic status (income levels and education) [1,28], physical [3,4] and psychological [5] health status (body mass index [BMI], physical activity, comorbidities, and depression), and nutritional intake (total energy intake and nutrients) [18] were selected as potential covariates.
- Income was measured as mean monthly household income and was used to categorise the participants into quartiles according to income. Participants were divided into 4 educational levels based on their final academic achievements: under middle school, middle school, high school, and college and above.
- The measured BMI was recorded in the KNHANES, and participants were divided into 4 groups based on the WHO BMI criteria for Asians [29]. Self-reported physical activity was assessed in the KNHANES: regular physical activity was defined as over 2.5 hours of moderate-intensity aerobic exercise, or 1.25 hours of high-intensity aerobic exercise, per week [30]. Comorbidities were assessed based on the presence of subjective discomfort in the 2 weeks preceding the interview due to acute or chronic diseases, or any form of accidents. History of depression was based on a past diagnosis by a physician.
- Total energy intake, calculated as kilocalories (kcal), was also included in the final model. Participants were assigned into 3 groups according to calorie intake. Total energy intake was considered adequate if the intake level fell between 75% and 125% of the age-specific and sex-specific dietary reference intake (DRI) [31], based on the national standards of the Ministry of Health and Welfare [7]. Intakes lower or equal to 75% of the DRI were considered inadequate, while intakes higher or equal to 125% of the DRI were considered as overconsumption. All energy-yielding nutrients (carbohydrate, protein, and fat) and other nutrients (total dietary fibre, sodium, potassium, calcium, phosphate, iron, and vitamins A, B2, B3, C) that were assessed in the KNHANES were included in the covariate selection process. All nutrients were adjusted for total energy. Energy-yielding nutrients were adjusted by the nutrient residual method due to high collinearity with energy intake [32], after log-transformation of the nutrients and energy intake. Identical to vitamin B1, other nutrients were adjusted for nutrient density per energy intake. Participants were categorised into high (≥50p) and low (<50p) intake groups for each nutrient.
- To select nutrients to be included as covariates, backwards selection with an inclusion and exclusion threshold of p<0.05 was used to reduce the remaining collinearity between nutrients, while thiamine and other covariates intended to be included remained in the model [18]. This left us with protein, sodium, and calcium intake to be included as covariates.
- Statistical Analysis
- The baseline demographic and dietary characteristics were compared according to sleep duration using the chi-square test for categorical variables and analysis of variance for continuous variables. Multinomial logistic regression models were established to evaluate the effects of thiamine on sleep duration. The normal sleep group (7-8 hours) was set as the reference group. Models were additionally adjusted for (1) age and sex, (2) socioeconomic factors, (3) physical and psychological health, and (4) nutritional intake. Finally, participants were stratified based on high-risk alcohol use according to our hypothesis that alcohol use modifies the relationship between low thiamine intake and oversleeping.
- Two sensitivity analyses were conducted to test the statistical stability of our estimates. The first sensitivity analysis defined low thiamine intake using unadjusted intake values, instead of using relative thiamine intake after adjustment for energy. Participants were dichotomised according to conventionally available cut-offs on recommended intake of thiamine. Two available cut-offs were used. First, participants with daily intake values lower than 0.5 mg/1000 kcal energy intake or 1 mg were classified as the low-intake group, according to the recommended dietary allowances of the United States [6]. Then, as an alternative cut-off, participants with daily intake values lower than 1.2 mg for males or 1.1 mg for females were classified as the low intake group, according to the DRIs for Koreans [7]. Another sensitivity analysis tested different cut-offs for the definition of normal sleep due to heterogeneity in defining an appropriate sleep duration in previous studies [26]. A normal sleep duration was defined as 6-8 hours, 7-9 hours, or 6-9 hours in the sensitivity analyses. Those who slept more or less than normal were classified as engaging in “insufficient sleep” and “oversleeping” respectively. All statistical analyses were conducted using SAS version 9.4 (SAS Institute inc., Cary, NC, USA).
- Ethics Statement
- The Institutional Review Board of Yonsei University advised that studies utilising deidentified secondary data could be conducted without board review. All procedures followed the ethical guidelines of the Helsinki Declaration and the ethical standards of relevant national and institutional committees on human experimentation.
METHODS
- Baseline Characteristics
- Baseline characteristics are displayed according to sleep duration (Table 1). Long sleepers (>8 hours) tended to be younger, and females were more likely to oversleep. Participants with higher income and education levels had lower probabilities of oversleeping. Those with lower BMI, lower energy intake, and inadequate physical activity were more susceptible to oversleeping. Participants with mental and physical comorbidities were more likely to experience oversleeping. No statistically significant differences were found for high-risk alcohol use.
- Dose-response Relationship Between Thiamine Intake and Oversleeping Risk
- Adjusted odds ratio (ORs) and confidence intervals (CIs) for oversleeping according to thiamine intake quartiles are listed in Table 2. Five multivariate logistic regression models were established. The group with the highest energy-adjusted thiamine intake quartile (Q4) was set as the reference group for all analyses. Lower intake of thiamine showed a statistically significant association with oversleeping (Q3: OR, 1.06; 95% CI, 0.86 to 1.32; Q2: OR, 1.24; 95% CI, 0.99 to 1.55; Q1: OR, 1.49; 95% CI, 1.16 to 1.91) in the final model, with a statistically significant trend showing higher ORs at lower thiamine intake (p-trend<0.001) (Table 2).
- Subgroup Analysis According to High-risk Alcohol Intake
- Adjusted ORs and CIs for oversleeping according to thiamine intake after stratification by alcohol use risk are listed in Table 3. The group with the highest energy-adjusted vitamin intake quartile and no high-risk alcohol use was set as the reference group for all analyses. Compared to the low-risk alcohol use group (Q1: OR, 1.51; 95% CI, 1.16 to 1.96), the high-risk alcohol use group showed a higher OR (Q1: OR, 1.78; 95% CI, 1.28 to 2.49) in the lowest thiamine intake group (Table 3).
- Sensitivity Analyses
- Adjusted ORs and CIs for oversleeping according to absolute thiamine intake were calculated. Participants with a daily intake lower than the 0.5 mg/1000 kcal or 1 mg criterion (n=1200) showed a consistent relationship with oversleeping in the final model (OR, 1.67; 95% CI, 1.26 to 2.20). Similarly, participants with a daily intake lower than the Korean DRIs (n=1929) also showed a relationship with oversleeping in the final model (OR, 1.36; 95% CI, 1.05 to 1.75) (Supplemental Material 1). Additionally, adjusted ORs and CIs for oversleeping according to thiamine intake quartiles using varying definitions of normal sleep duration were obtained. The relationship between low thiamine intake and oversleeping remained statistically significant throughout all definitions on sleeping duration. The ORs for oversleeping in the lowest thiamine intake group were higher when oversleeping was defined more strictly, as over 9 hours of daily sleep (normal sleep 7-9 hours daily: OR, 2.06; 95% CI, 1.35 to 3.15; normal sleep 6-9 hours daily: OR, 2.11; 95% CI, 1.38 to 3.22), than when it was defined as over 8 hours of daily sleep (normal sleep 6-8 hours daily: OR, 1.51; 95% CI, 1.18 to 1.93) (Supplemental Material 2).
RESULTS
- In our study, marginally low intake of thiamine was positively associated with oversleeping. There also was a significant trend in the dose-response relationship, and the ORs for oversleeping were amplified when participants showed high-risk alcohol use. These findings were consistent among different definitions of low thiamine intake and normal sleeping durations.
- While there are a limited number of observational studies regarding the relationship between thiamine intake and long sleep durations, previous studies have found no clear associations between low thiamine intake and extensive sleep [18-20]. A possible explanation is that there may be differences in susceptibility in varying populations. In contrast to our study, previous studies were done on different nationalities [18,19] or adolescents [20]. Genetic, cultural, or developmental differences in sleep or nutrient metabolism could have caused heterogeneity in the susceptible population. Therefore, it would be important to investigate the relationship between thiamine intake and prolonged sleep in diverse populations for a further understanding of the potential mechanisms.
- One mechanism that could explain oversleeping in association with low thiamine intake is that thiamine acts as a co-enzyme for adenosine triphosphate (ATP) production [8]. While ATP is a universal intracellular energy source in multiple tissues, sleep is suggested to be necessary for replenishing ATP in the nervous system [33]. Conversely, sleep restriction inhibits this process and thus decreases ATP levels in certain areas of the brain containing sleep-regulating neurons [34] that have been found to be damaged in other neuropsychiatric disorders caused by prolonged thiamine deficiency in alcoholics. Furthermore, the known hypnogenic properties of adenosine [35], the degradation product and ingredient of ATP, have been suggested to be a mediator between lowered ATP levels and sleep induction [36], which further supports our explanation that low thiamine intake may lead to prolonged sleep.
- The stronger relationship with high-risk alcohol users could be explained by the effect of alcohol on thiamine metabolism [21]. Drinking causes not only inadequate dietary intake of thiamine, but also decreased gastrointestinal absorption and impaired cellular utilisation [21]. This common mechanism that causes neuropsychiatric disorders [22] and irreversible brain damage [21] through thiamine deficiency may also be applicable in the relationship with sleep, since excessive alcohol use further diminishes internal thiamine reservoirs.
- A strength of our study is the large number of participants, compared to previous exploratory studies describing the relationship between nutrient intake and sleep duration [18-20]. Furthermore, the structure of the KNHANES dataset allowed us to represent the entire Korean population. Furthermore, the use of a validated questionnaire, consistent results among sensitivity analyses, and the proposal of potential mechanisms for our findings also strengthen our study. Finally, our study found a potential relationship with prolonged sleep in a food-secure environment where thiamine deficiency is rare [9], thus suggesting the possibility that marginal intake may also be harmful.
- However, we are aware of several limitations to our study. First, this study cannot be used to infer causality due to its cross-sectional nature. Further investigations with longitudinal datasets will help demonstrate causality. Another limitation is that self-reported sleep duration is known to moderately represent actual sleep duration [37], as there could be measurement errors. Due to the large number of participants, objective methods, such as polysomnography and actigraphy, could not be applied. However, people with normal sleep durations tend to overreport their sleeping duration [37], and this misclassification dampens the differentiation between normal participants and oversleeping participants. Therefore, the obtained strength of association may have been somewhat underestimated. Our sensitivity analysis with a stricter definition of oversleeping as over 9 hours of daily sleep supports this explanation, as it yielded higher OR estimates than when oversleeping was defined as over 8 hours of daily sleep. Finally, quality of sleep was not included in the analysis. Sleep duration and quality have a low correlation [38] and are independently related to physical and mental health [39]. Although sleep duration has served as a useful variable to explain trends and disparities in health among populations [40], data on sleep quality would provide a better understanding of these relationships [38]. Other measures of sleep, such as sleep onset latency and daytime symptoms, or other variables such as treatment modalities for depression and thiamine intake from supplements were also not included in the original dataset, thus leaving possible residual confounding despite thorough adjustments. Well-structured primary data addressing more of the aforementioned variables are necessary.
- Our findings are of interest since they revealed that insufficient intake of thiamine could be related to oversleeping in a food-secure population without severe deficiencies. The effect modification of high-risk alcohol use further supports our hypothesis regarding the role of thiamine in sleep regulation. Previous studies and data suggest that a substantial population, including Korea, may be at risk for marginal thiamine deficiency. Therefore, oversleeping and its related adverse health outcomes due to marginal thiamine deficiency may have been overlooked. The potential effect of dietary thiamine intake on sleep duration should not be ignored, especially for those at high risk due to alcohol overuse. Furthermore, sleep-related factors should also be assessed in patients with neuropsychiatric disorders caused by alcohol overuse, since such factors could be masked by more well-marked symptoms of the disorders. Further studies using datasets that focus more closely on sleep-related variables and show temporality to prove causality are necessary.
DISCUSSION
Supplementary materials
-
CONFLICT OF INTEREST
The authors have no conflicts of interest associated with the material presented in this paper.
-
FUNDING
This research was supported by the Basic Science Research Program through the National Research Foundation of Korea (NRF), funded by the Ministry of Science and ICT (NRF-2020- R1C1C1003502).
Notes
ACKNOWLEDGEMENTS
-
AUTHOR CONTRIBUTIONS
Conceptualization: Lee D, Jung SJ. Data curation: Lee D. Formal analysis: Lee D, Kim K. Funding acquisition: Jung SJ. Methodology: Lee D, Kim K, Oh K, SJJ. Project administration: Kim K, Jung SJ. Visualization: Lee D, Kim K, Lee Y. Writing – original draft: Lee D. Writing – review & editing: Lee D, Kim K, Lee Y, Oh K, Jung SJ.
Notes

| Characteristics | Insufficient sleep (<7 hr, n=6131) | Normal sleep (7-8 hr, n=7874)1 | Oversleep (>8 hr, n=1379) | p-value2 | |
|---|---|---|---|---|---|
| Thiamine intake quartiles (percentile) | 0.109 | ||||
| Lowest, Q1 (<25th) | 1538 (39.81) | 1922 (50.43) | 386 (9.76) | ||
| Low, Q2 (25-50th) | 1507 (39.40) | 1983 (51.27) | 356 (9.33) | ||
| High, Q3 (50-75th) | 1477 (37.92) | 2041 (53.33) | 328 (8.74) | ||
| Highest, Q4 (>75th) | 1609 (41.02) | 1928 (50.90) | 309 (8.09) | ||
| Age, mean±SE (y) | 42.68±0.21 | 40.88±0.19 | 37.11±0.43 | <0.001 | |
| Sex | <0.001 | ||||
| Male | 2350 (40.53) | 3076 (52.40) | 408 (7.07) | ||
| Female | 3781 (38.64) | 4798 (50.63) | 971 (10.73) | ||
| Household income quartiles (percentile) | 0.006 | ||||
| Lowest, Q1 (<25th) | 1628 (40.37) | 1829 (48.99) | 381 (10.64) | ||
| Low, Q2 (25-50th) | 1470 (38.80) | 2028 (52.32) | 351 (8.87) | ||
| High, Q3 (50-75th) | 1474 (38.33) | 2050 (53.43) | 331 (8.25) | ||
| Highest, Q4 (>75th) | 1559 (40.63) | 1967 (50.98) | 316 (8.39) | ||
| Education levels | <0.001 | ||||
| Under middle school | 776 (45.61) | 706 (45.36) | 142 (9.03) | ||
| Middle school | 580 (41.85) | 677 (48.61) | 142 (9.54) | ||
| High school | 2398 (39.42) | 3047 (50.75) | 565 (9.83) | ||
| College and above | 2377 (38.00) | 3444 (53.86) | 530 (8.14) | ||
| Body mass index (kg/m2) | <0.001 | ||||
| Underweight (<18.5) | 231 (32.18) | 382 (53.91) | 88 (13.90) | ||
| Normal (18.5-22.9) | 2375 (37.02) | 3372 (53.05) | 638 (9.94) | ||
| Overweight (23.0-24.9) | 1421 (40.38) | 1783 (51.80) | 261 (7.82) | ||
| Obese (≥25.0) | 2104 (43.31) | 2337 (48.75) | 392 (7.94) | ||
| Physical activity | 0.004 | ||||
| Inadequate exercise | 3229 (38.52) | 4259 (51.67) | 806 (9.81) | ||
| Adequate exercise | 2902 (40.57) | 3615 (51.22) | 573 (8.20) | ||
| Comorbidities3 | <0.001 | ||||
| Yes | 1109 (44.03) | 1139 (46.32) | 229 (9.66) | ||
| No | 5022 (38.71) | 6735 (52.37) | 1150 (8.92) | ||
| Depression | <0.001 | ||||
| Yes | 179 (50.52) | 147 (39.54) | 46 (9.94) | ||
| No | 5952 (39.26) | 7727 (51.73) | 1333 (9.01) | ||
| Total kcal intake (% DRI) | 0.024 | ||||
| Inadequate (≤75) | 1588 (40.45) | 1866 (49.85) | 366 (9.70) | ||
| Adequate (75-125) | 3407 (38.41) | 4624 (52.74) | 766 (8.86) | ||
| Overconsumption (≥125) | 1136 (41.73) | 1384 (49.60) | 247 (8.67) | ||
| Calorie-adjusted protein intake (percentile) | 0.004 | ||||
| High (≥50th) | 3175 (41.23) | 3875 (50.59) | 642 (8.18) | ||
| Low (<50th) | 2956 (37.79) | 3999 (52.32) | 737 (9.89) | ||
| Calorie-adjusted sodium intake (percentile) | 0.047 | ||||
| High (≥50th) | 3040 (38.88) | 3970 (52.08) | 682 (9.04) | ||
| Low (<50th) | 3091 (40.18) | 3904 (50.80) | 697 (9.02) | ||
| Calorie-adjusted calcium intake (percentile) | 0.095 | ||||
| High (≥50th) | 2991 (38.76) | 3968 (51.80) | 733 (9.45) | ||
| Low (<50th) | 3140 (40.36) | 3906 (51.07) | 646 (8.57) | ||
| Alcohol consumption | 0.660 | ||||
| Low-risk alcohol use | 5448 (39.37) | 7031 (51.53) | 1230 (9.10) | ||
| High-risk alcohol use | 683 (40.54) | 843 (50.89) | 149 (8.57) | ||
Values are presented as number (weihtted %).
SE, standard error; DRI, dietary reference intake.
1 Cut-off values for sleep were set from previous studies regarding nutrient intake and sleep [18].
2 Categorical variables were tested using the chi-square test, and continuous variables were tested using analysis of variance.
3 Comorbidities were defined as subjective discomfort due to any form of acute/chronic diseases or accidents.
| Quartile1 | Model 12 | Model 23 | Model 34 | Model 45 | Model 56 |
|---|---|---|---|---|---|
| Q4 (highest thiamine intake) | 1.00 (reference) | 1.00 (reference) | 1.00 (reference) | 1.00 (reference) | 1.00 (reference) |
| Q3 | 1.04 (0.85, 1.28) | 1.04 (0.84, 1.28) | 1.03 (0.84, 1.27) | 1.03 (0.84, 1.27) | 1.06 (0.86, 1.32) |
| Q2 | 1.14 (0.94, 1.38) | 1.17 (0.96, 1.44) | 1.17 (0.95, 1.43) | 1.16 (0.95, 1.42) | 1.24 (0.99, 1.55) |
| Q1 (lowest thiamine intake) | 1.27 (1.05, 1.54) | 1.42 (1.16, 1.74) | 1.36 (1.11, 1.66) | 1.33 (1.08, 1.63) | 1.49 (1.16, 1.91) |
Values are presented as odds ratio (95% confidence interval).
1 Median intake mg/day: Q4 (1.97), Q3 (1.84), Q2 (1.72), Q1 (1.52).
2 Unadjusted model.
3 Adjusted for age and sex.
4 <Model 2>+additionally adjusted for socioeconomic factors (income, education levels).
5 <Model 3>+additionally adjusted for physical and psychological health status (body mass index, physical exercise, comorbidities, depression).
6 <Model 4>+additionally adjusted for nutritional intake (total energy intake and relevant nutrients selected by backwards selection).
| Quartile | Low-risk alcohol use (n=13 709) | High-risk alcohol use (n=1675)2 |
|---|---|---|
| Q4 (highest thiamine intake) | 1.00 (reference) | 1.18 (0.55, 2.54) |
| Q3 | 1.10 (0.89, 1.38) | 0.89 (0.46, 1.76) |
| Q2 | 1.31 (1.04, 1.64) | 1.18 (0.74, 1.89) |
| Q1 (lowest thiamine intake) | 1.51 (1.16, 1.96) | 1.78 (1.28, 2.49) |
Values are presented as odds ratio (95% confidence interval).
Total number of participants in each group regardless of sleeping duration grouping is represented by number.
1 The model fully adjusted for age, sex, socioeconomic factors, medical factors, and relevant nutrients was used.
2 High-risk alcohol use was defined based on the International Guide for Monitoring Alcohol Consumption and Related Harm [27].
- 1. Cappuccio FP, D’Elia L, Strazzullo P, Miller MA. Sleep duration and all-cause mortality: a systematic review and meta-analysis of prospective studies. Sleep 2010;33(5):585-592ArticlePubMedPMC
- 2. Gallicchio L, Kalesan B. Sleep duration and mortality: a systematic review and meta-analysis. J Sleep Res 2009;18(2):148-158ArticlePubMed
- 3. Mesas AE, López-García E, León-Muñoz LM, Guallar-Castillón P, Rodríguez-Artalejo F. Sleep duration and mortality according to health status in older adults. J Am Geriatr Soc 2010;58(10):1870-1877ArticlePubMed
- 4. Kakizaki M, Kuriyama S, Nakaya N, Sone T, Nagai M, Sugawara Y, et al. Long sleep duration and cause-specific mortality according to physical function and self-rated health: the Ohsaki Cohort Study. J Sleep Res 2013;22(2):209-216ArticlePubMed
- 5. Hublin C, Partinen M, Koskenvuo M, Kaprio J. Sleep and mortality: a population-based 22-year follow-up study. Sleep 2007;30(10):1245-1253ArticlePubMedPMC
- 6. National Research Council. Recommended dietary allowances. 10th ed. Washington, DC: National Academies Press; 1989. p. 125-129
- 7. Korean Nutrition Society. Dietary reference intakes for Koreans 2020: vitamins. Sejong: Ministry of Health and Welfare; 2020. p. 168 (Korean)
- 8. World Health Organization. Thiamine deficiency and its prevention and control in major emergencies. 1999 [cited 2022 Aug 26]. Available from: https://www.who.int/publications/i/item/WHO-NHD-99.13
- 9. Whitfield KC, Bourassa MW, Adamolekun B, Bergeron G, Bettendorff L, Brown KH, et al. Thiamine deficiency disorders: diagnosis, prevalence, and a roadmap for global control programs. Ann N Y Acad Sci 2018;1430(1):3-43ArticlePubMedPMCPDF
- 10. Temu P, Temple VJ, Saweri A, Saweri W. Thiamine (vitamin B1) status of boarding school students in the Southern Region of Papua New Guinea. P N G Med J 2009;52(1-2):21-27PubMed
- 11. O’Keeffe ST, Tormey WP, Glasgow R, Lavan JN. Thiamine deficiency in hospitalized elderly patients. Gerontology 1994;40(1):18-24ArticlePubMedPDF
- 12. Korea Disease Control and Prevention Agency. Korea health statistics 2020: Korea National Health and Nutrition Examination Survey (KNHANES VIII-2). Cheongju: Korea Disease Control and Prevention Agency; 2022. p. 127 (Korean)
- 13. Fattal-Valevski A. Thiamine (vitamin B1). J Evid Based Complementary Altern Med 2011;16(1):12-20ArticlePDF
- 14. Yoshimura K, Nishibe Y, Inoue Y, Hirono S, Toyoshima K. Animal experiments on thiamine avitaminosis and cerebral function. J Nutr Sci Vitaminol (Tokyo) 1976;22(6):429-437ArticlePubMed
- 15. Crespi F, Jouvet M. Sleep and indolamine alterations induced by thiamine deficiency. Brain Res 1982;248(2):275-283ArticlePubMed
- 16. Smidt LJ, Cremin FM, Grivetti LE, Clifford AJ. Influence of thiamin supplementation on the health and general well-being of an elderly Irish population with marginal thiamin deficiency. J Gerontol 1991;46(1):M16-M22ArticlePubMed
- 17. Wilkinson TJ, Hanger HC, Elmslie J, George PM, Sainsbury R. The response to treatment of subclinical thiamine deficiency in the elderly. Am J Clin Nutr 1997;66(4):925-928ArticlePubMed
- 18. Grandner MA, Jackson N, Gerstner JR, Knutson KL. Dietary nutrients associated with short and long sleep duration. Data from a nationally representative sample. Appetite 2013;64: 71-80ArticlePubMedPMC
- 19. Çakir B, Nişancı Kılınç F, Özata Uyar G, Özenir Ç, Ekici EM, Karaismailoğlu E. The relationship between sleep duration, sleep quality and dietary intake in adults. Sleep Biol Rhythms 2020;18(1):49-57ArticlePDF
- 20. Lee JH, Chung SJ, Seo WH. Association between self-reported sleep duration and dietary nutrients in Korean adolescents: a population-based study. Children (Basel) 2020;7(11):221ArticlePubMedPMC
- 21. Martin PR, Singleton CK, Hiller-Sturmhöfel S. The role of thiamine deficiency in alcoholic brain disease. Alcohol Res Health 2003;27(2):134-142PubMedPMC
- 22. Cook CC, Hallwood PM, Thomson AD. B Vitamin deficiency and neuropsychiatric syndromes in alcohol misuse. Alcohol Alcohol 1998;33(4):317-336ArticlePubMed
- 23. Kweon S, Kim Y, Jang MJ, Kim Y, Kim K, Choi S, et al. Data resource profile: the Korea National Health and Nutrition Examination Survey (KNHANES). Int J Epidemiol 2014;43(1):69-77ArticlePubMedPMC
- 24. Kim DW, Song S, Lee JE, Oh K, Shim J, Kweon S, et al. Reproducibility and validity of an FFQ developed for the Korea National Health and Nutrition Examination Survey (KNHANES). Public Health Nutr 2015;18(8):1369-1377ArticlePubMed
- 25. Dietch JR, Sethi K, Slavish DC, Taylor DJ. Validity of two retrospective questionnaire versions of the Consensus Sleep Diary: the whole week and split week Self-Assessment of Sleep Surveys. Sleep Med 2019;63: 127-136ArticlePubMed
- 26. Grandner MA, Patel NP, Gehrman PR, Perlis ML, Pack AI. Problems associated with short sleep: bridging the gap between laboratory and epidemiological studies. Sleep Med Rev 2010;14(4):239-247ArticlePubMed
- 27. World Health Organization. International guide for monitoring alcohol consumption and related harm; 2000 [cited 2022 Jul 13]. Available from: https://apps.who.int/iris/handle/10665/66529
- 28. Smagula SF, Stone KL, Fabio A, Cauley JA. Risk factors for sleep disturbances in older adults: evidence from prospective studies. Sleep Med Rev 2016;25: 21-30ArticlePubMed
- 29. World Health Organization. The Asia-Pacific perspective: redefining obesity and its treatment; 2000 [cited 2022 Aug 26]. Available from: https://apps.who.int/iris/handle/10665/206936
- 30. Oh JY, Yang YJ, Kim BS, Kang JH. Validity and reliability of Korean version of International Physical Activity Questionnaire (IPAQ) short form. J Korean Acad Fam Med 2007;28: 532-541. (Korean)
- 31. Yun S, Kim HJ, Oh K. Trends in energy intake among Korean adults, 1998-2015: results from the Korea National Health and Nutrition Examination Survey. Nutr Res Pract 2017;11(2):147-154ArticlePubMedPMCPDF
- 32. Willett WC, Howe GR, Kushi LH. Adjustment for total energy intake in epidemiologic studies. Am J Clin Nutr 1997;65(4 Suppl):1220S-1228SArticlePubMed
- 33. Chikahisa S, Séi H. The role of ATP in sleep regulation. Front Neurol 2011;2: 87ArticlePubMedPMC
- 34. Dworak M, McCarley RW, Kim T, Kalinchuk AV, Basheer R. Sleep and brain energy levels: ATP changes during sleep. J Neurosci 2010;30(26):9007-9016ArticlePubMedPMC
- 35. Watson CJ, Baghdoyan HA, Lydic R. Neuropharmacology of sleep and wakefulness. Sleep Med Clin 2010;5(4):513-528ArticlePubMedPMC
- 36. Benington JH, Heller HC. Restoration of brain energy metabolism as the function of sleep. Prog Neurobiol 1995;45(4):347-360ArticlePubMed
- 37. Lauderdale DS, Knutson KL, Yan LL, Liu K, Rathouz PJ. Self-reported and measured sleep duration: how similar are they? Epidemiology 2008;19(6):838-845PubMedPMC
- 38. Pilcher JJ, Ginter DR, Sadowsky B. Sleep quality versus sleep quantity: relationships between sleep and measures of health, well-being and sleepiness in college students. J Psychosom Res 1997;42(6):583-596ArticlePubMed
- 39. Seow LS, Tan XW, Chong SA, Vaingankar JA, Abdin E, Shafie S, et al. Independent and combined associations of sleep duration and sleep quality with common physical and mental disorders: results from a multi-ethnic population-based study. PLoS One 2020;15(7):e0235816ArticlePubMedPMC
- 40. Caraballo C, Mahajan S, Valero-Elizondo J, Massey D, Lu Y, Roy B, et al. Evaluation of temporal trends in racial and ethnic disparities in sleep duration among US adults, 2004-2018. JAMA Netw Open 2022;5(4):e226385ArticlePubMedPMC
REFERENCES
Figure & Data
References
Citations
- The Therapeutic Potential of Vitamins B1, B3 and B6 in Charcot–Marie–Tooth Disease with the Compromised Status of Vitamin-Dependent Processes
Victoria Bunik
Biology.2023; 12(7): 897. CrossRef - Enhancing Sleep Quality: Assessing the Efficacy of a Fixed Combination of Linden, Hawthorn, Vitamin B1, and Melatonin
Matteo De Simone, Rosario De Feo, Anis Choucha, Elena Ciaglia, Francis Fezeu
Medical Sciences.2023; 12(1): 2. CrossRef
 PubReader
 ePub Link
 Cite
Cite