Articles
- Page Path
- HOME > J Prev Med Public Health > Volume 51(4); 2018 > Article
-
Original Article
Regimen-related Mortality Risk in Patients Undergoing Peritoneal Dialysis Using Hypertonic Glucose Solution: A Retrospective Cohort Study -
Chinakorn Sujimongkol1
 , Cholatip Pongskul2, Supannee Promthet3
 -
Journal of Preventive Medicine and Public Health 2018;51(4):205-212.
DOI: https://doi.org/10.3961/jpmph.18.066
Published online: June 19, 2018
- 4,695 Views
- 136 Download
- 1 Crossref
1Doctor of Public Health Program, Faculty of Public Health, Khon Kaen University, Khon Kaen, Thailand
2Division of Nephrology, Department of Medicine, Khon Kaen University, Khon Kaen, Thailand
3Department of Epidemiology and Biostatistics, Faculty of Public Health, Khon Kaen University, Khon Kaen, Thailand
- Corresponding author: Supannee Promthet, PhD Department of Epidemiology and Biostatistics, Faculty of Public Health, Khon Kaen University, Khon Kaen 40002, Thailand E-mail: supannee@kku.ac.th
Copyright © 2018 The Korean Society for Preventive Medicine
This is an Open Access article distributed under the terms of the Creative Commons Attribution Non-Commercial License (http://creativecommons.org/licenses/by-nc/4.0/) which permits unrestricted non-commercial use, distribution, and reproduction in any medium, provided the original work is properly cited.
ABSTRACT
-
Objectives
- The main purpose of this study was to quantify the risk of mortality linked to various regimens of hypertonic peritoneal dialysis (PD) solution.
-
Methods
- A retrospective cohort study of patients using home-based PD was carried out. The prescribed regimen of glucose-based PD solution for all patients, determined on the basis of their individual conditions, was extracted from their medical chart records. The primary outcome was death. The treatment regimens were categorized into 3 groups according to the type of PD solution used: original PD (1.5% glucose), shuffle PD (1.5 and 2.5% glucose), and serialized PD (2.5 and 4.5% glucose). Multivariate analysis (using the Weibull model) was applied to comprehensively examine survival probabilities related to the explanatory variable, while adjusting for other potential confounders.
-
Results
- Of 300 consecutive patients, 38% died over a median follow-up time of 30 months (interquartile range: 15-46 months). Multivariate analysis showed that a treatment regimen with continued higher-strength PD solution (serialized PD) resulted in a lower survival rate than when the conventional strength solution was used (adjusted hazard ratio, 2.6; 95% confidence interval, 1.6 to 4.6, p<0.01). Five interrelated risk factors (age, length of time on PD, hemoglobin levels, albumin levels, and oliguria) were significant predictors contributing to the outcome.
-
Conclusions
- Frequent exposure to high levels of glucose PD solution significantly contributed to a 2-fold higher rate of death, especially when hypertonic glucose was prescribed continuously.
- Preserving the integrity of the peritoneal membrane for a longer time is one of the core goals for enhancing survival in patients undergoing long-term peritoneal dialysis (PD) [1]. Unfortunately, most of these patients encounter unavoidable and deleterious effects of glucose-based dialysate, including structural changes (deterioration of the peritoneal membrane over time), functional changes (e.g., an increased risk of developing insulin resistance and elevated blood glucose) [2-6], and even possibly mortality [5]. These negative effects have been reported to be a consequence of prolonged exposure to higher glucose concentrations [7-9]. However, although adverse effects from high glucose-based dialysis solutions are known to exist, it is still necessary in certain clinical conditions to use a conventional PD prescription, particularly in regions where non-glucose-based PD solutions are difficult to obtain or unaffordable due to high costs. Moreover, the difference in survival outcomes is still uncertain [10]. In keeping with the latest guidelines of the International Society for Peritoneal Dialysis (ISPD) [11,12], cautious short-term use of high-tonicity solutions is acceptable, but unambiguous and detailed dosing recommendations are not available for when use of a high-osmolarity agent is necessary. In the absence of a clearly identified preference, we assume that a wide range of prescriptions and regimens for high-osmolarity agents are used. In addition, adherence to daily adjustment of the dialysis prescription seems to be an extraordinary challenge for the at-home patient, particularly in remote areas, and most of the published work on this topic does not seem to reflect a routine clinical setting. While the diverse regimens may address the benefit-risk balance in routine clinical practice, to date, it is unclear whether there are differences between the various regimens of glucose-based PD solutions in terms of survival outcomes.
- Rapid adverse events involving the peritoneal membrane may be prevented by exposure to lower doses of glucose-based PD solution. Measuring the predicted risk with various hypertonic solutions and regimens may help support clinicians’ decision-making by providing robust and rigorous evidence. Thus, this study attempted to establish the regimen-related mortality risk for alternative regimens in clinical practice, with the goal of improving survival outcomes. Therefore, the main purpose of this study was to determine the probability of risk of death in patients using different regimens of PD solution.
INTRODUCTION
- Study Design and Site
- This study was a retrospective cohort chart review of patients undergoing continuous ambulatory peritoneal dialysis (CAPD) who were registered with a PD facility between October 1, 2011 and September 30, 2016 and followed until January 31, 2017 at a single government-run general hospital in Thailand.
- Inclusion and Exclusion Criteria
- The eligible criteria included patients with newly initiated PD who were undergoing CAPD covered under the government’s universal coverage scheme for renal dialysis (a fairly homogenous socioeconomic group), were aged 20 years or older, and were on a home-based PD exchange regimen. Patients were excluded from the study if they had the following conditions: polycystic kidney disease, malignancy, liver disease, were in a bedridden condition, or died within 3 months of starting PD. Patients who were unable to attend the PD center for regularly scheduled follow-up, regardless of the center protocol, were also excluded. The recorded information included demographics, prescribed PD solutions, and duration of therapy (start date, event date). A particular focus was placed on data about PD prescription regimens. Subsequently, the treatment regimens were collected and categorized according to the course of prescriptions of solutions for dialysis performed independently at home, which were used to define 3 prescribed PD regimens: the original PD group comprised patients who only underwent PD with conventional-strength glucose solution (1.5% PD solution); the shuffle PD group comprised patients who were treated with a 1.5% solution that was changed to a 2.5% solution, or cycled back and forth between the 1.5% PD and the 2.5% PD solutions for daily PD (regimen continuously used for longer than 90 consecutive days); and the serialized PD group comprised patients who serially underwent continuous dialysis with either 2.5% PD or alternated between 2.5 and 4.2% PD (similarly, with the regimen continuously used for longer than 90 consecutive days). For all regimens, the origin time was marked as the time point when exposure to the solution commenced, and the patient was followed until the outcome of interest. The primary outcome was death, and this endpoint was defined as the time of failure. Observations were censored if patients discontinued PD therapy for any reason (e.g., switching modes to either hemodialysis or transplantation, were lost to follow-up, or were alive at the end of the follow-up period).
- Of the 330 patients who initiated CAPD at our study site between October 2011 and September 2016, 30 were excluded: 12 patients were younger than 20, 16 died or had a treatment change within less than 3 months, and 2 had pre-existing conditions preventing eligibility. The remaining 300 patients were enrolled and followed until January 2017, with 146 (48.7%) categorized into the original PD group, 101 (33.7%) categorized into the shuffle PD group, and 53 (17.7%) categorized into the serialized PD group.
- Clinical Data
- Either paper or electronic medical records were the primary sources of data information. Consequently, mortality status was extracted and linked with multiple data sources. According to several previous studies [13-16], age, gender, diabetes mellitus (DM), cardiovascular disease (CVD), history of peritonitis, residual renal output (RUO), length of time on PD, and hemoglobin (Hb) and albumin (Alb) levels are well documented as potential risk factors for mortality among PD patients. Thus, these factors were gathered for use as covariates. Urine volume was measured by daily self-reporting on estimated urine output. Since these patients’ blood chemistry levels fluctuated throughout the time of the study, both serum Alb and blood Hb concentrations were collected longitudinally at regular clinic visits (typically, the follow-up visits were scheduled at 3-month intervals). Clinical presentation and positive results from dialysate fluid culture were defined as peritoneal dialysis-related peritonitis. Based on findings from previous studies [5,17], we applied the formula used by Schoenfeld [18] to calculate sample size for both exposed and non-exposed outcomes with a significance of 0.05 and a power of 0.8; a total of 300 consecutive patients were required.
- Statistical Methods
- The demographic results were summarized as percentages for dichotomous variables and mean values and standard deviations for continuous variables. Multivariate analysis (using the Weibull model) was applied to comprehensively examine survival probabilities related to the explanatory variable, while adjusting for other potential confounders. A backward selection procedure was employed to fit the final analysis, with the results expressed as adjusted hazard ratios (aHRs) with 95% confidence intervals (CIs), and the significance level was 0.05. We used Stata version 15 (StataCorp., College Station, TX, USA).
- Ethical Statements
- The study protocol was approved by both the Khon Kaen University ethics committee and the institutional review board for data collection (HE 602253 and EC 008/2016).
METHODS
- Patient Characteristics
- In total, 300 consecutive patients with documented CAPD prescriptions during 6604 person-months of observation were eligible for analysis. The distribution of person-months of observation the three categories was 3673, 1823, and 1108 person-months for the original, shuffle, and serialized PD groups, respectively. The final status of patients at the end-point of the study was 62% alive and 38% who had died throughout a median follow-up time of 30 months (interquartile range, 15-46 months), based on the reverse Kaplan-Meier method [19]. The leading causes of death were sepsis, CVD, electrolyte imbalance, and pneumonia. Table 1 shows the characteristics of the study population. In all 3 groups, the age profiles and gender distribution were quite similar. Risk factors, including the prevalence of CVD and DM, and clinical data, such as Alb and Hb levels, were similar among the 3 groups. However, a history of peritonitis was more common in the shuffle PD group than the original PD group, and still higher in the serialized PD group (overall presence in more than 50% of the participants). Around one-third of the patients were diagnosed with pre-existing DM. The majority of patients underwent PD treatment for longer than 2 years in all 3 groups, with an average duration of PD treatment of 25.1, 27.1, and 29.0 months in the original, shuffle, and serialized PD groups, respectively.
- Univariate Analysis of Risk Factors
- In the univariate analysis shown in Table 2. Among the confounding factors, higher age, lower Hb levels, lower Alb levels, lower RUO, and the presence of DM and CVD were significantly associated with an increased risk of all-cause mortality. Hb levels were a risk factor because many enrolled patients developed chronic anemia. Every 1 g/dL increase in Hb reduced risk by 20%. For the analysis, we dichotomized Hb concentrations as lower or higher than 10 g/dL. We found that patients who had Hb levels ≥10 g/dL had a 53% lower risk of death. When we compared Alb levels, there was an almost 75% decreased risk for every increase of 1 g/dL. For analysis, we dichotomized participants based on Alb levels, regardless of persistent hypoalbuminemia, using a cut-off point of 2.5 g/dL. We found patients with Alb levels >2.5 g/dL had an hazard ratio (HR) of 0.2. Survival time significantly increased by 3% for every 1 mL increase in urine output per day; however, the 95% confidence limit was extremely narrow. Thus, patients were categorized as having either oliguria or anuria (urine volume between 0-200 mL/d) or a urine output ≥200 mL/d. Patients with anuria/oliguria had a higher risk of death than patients with a urine volume ≥200 mL/d. The presence of CVD in PD patients was associated with a 2.7 times higher risk of mortality. For each additional month of the patient’s length of time undergoing PD, the risk of death decreased by 17% (HR, 0.8).
- As the treatment regimen was the main point of interest, the median survival times were 48.9, 43.7, and 25.1 months, and the mortality rate for each regimen was 1.3,1.8, and 2.7 per 100 person-months in the original, shuffle and serialized PD groups, respectively. The crude HRs associated with the treatment regimen were 1.5 (95% CI, 0.9 to 2.3; p<0.1) and 2.2 (95% CI, 1.3 to 3.4; p<0.01) for the shuffle and the serialized PD groups, respectively.
- Multivariate Analysis
- For the multivariate analysis (using the Weibull model), we used a backward selection strategy to comprehensively examine survival probabilities related to the intervening variable while adjusting for other potential confounders; the final model is shown in Table 3. The selected covariates that were employed to probe the interrelationships of potential risk factors were age, gender, peritonitis, DM, RUO, Hb, and Alb levels, and length of time on PD.
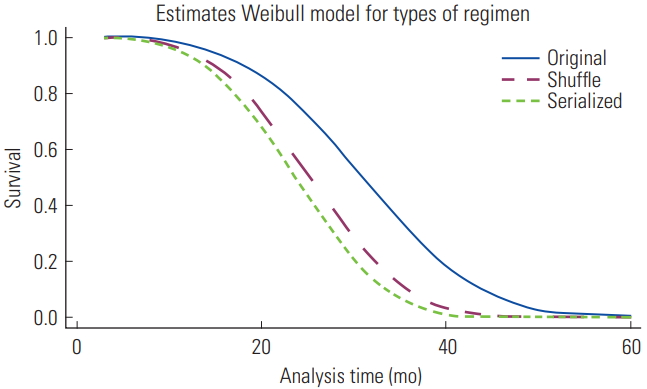
- In the final model (Table 3), patients with PD who were prescribed a continuous exchange of hypertonic glucose solutions were 2.6 times (95% CI, 1.6 to 4.6; p<0.01) more likely to die than patients who did not receive hypertonic exchanges. Similarly to the serialized, the shuffle PD regimen was found to pose a significant risk (aHR, 2.2; 95% CI, 1.4 to 3.4; p<0.01) when compared with the original PD group. Figure 1 shows the survival curves of patients undergoing different PD regimens according to the Weibull model, indicating that after patients received treatment with either intermittent (shuffle) or continuous (serialized) high-glucose dialysate regimens for around 20 months, the probability of survival was markedly lower than among those undergoing treatment with low-concentration glucose dialysate (original).
- Additionally, for all treatment regimens, 5 interrelated risk factors emerged as significant predictors contributing to the outcomes: low Hb concentration, low Alb level, anuria or oliguria, advanced age, and short duration of receiving PD.
RESULTS
- This investigation focused on survival according to treatment regimens. Multivariate analysis showed that treatment regimens using either a combination of concentrations (1.5 and 2.5% PD) regimen (shuffle) or a continuous higher-concentration PD solution for exchange (serialized PD) was associated with an approximately 2-fold greater attenuation of survival than the conventional concentration regimen. The percentage of overall deaths in patients undergoing PD throughout the study period is similar to that reported in a previous longitudinal study [20]. We found that sepsis was the leading cause of death. Sepsis resulting from peritonitis is a possible explanation for this finding, because more than half of the patients in the current study had a history of PD-related peritonitis.
- The etiological mechanism of increased mortality in patients prescribed high-glucose dialysate is still uncertain. Previous work [17,21,22] has only proposed theoretical possibilities for factors influencing patient survival, and some of these studies did not yield convincing conclusions regarding the heightened risks of negative outcomes. We suggest that a plausible causal pathway was described by Hassan et al. [23]. It begins with peritoneal glucose dialysate-induced inflammation of the peritoneum, which may even progress to fibrosis [2], and metabolic effects from glucose loading, leading to a reduction in ultrafiltration and clearance, which is then dynamically linked to the occurrence of cardiovascular problems [24]. In light of our main findings, the following points briefly clarify our hypothesis. First, the destruction of peritoneal mesothelial cells has been reported in previous studies, and in particular, it has found to be higher after exposure to 4.2% dextrose [3,25]. Kang et al. [26] found that various incremental ranges in glucose concentrations, including 30, 60, and 90 mmol/L, caused 2.3-, 3.6-, and 4.0-fold increases in the induced fibrosis factor, respectively. Combining these findings with other theoretical suggestions, it can be inferred that the proportional increase was induced by the incremental changes in concentration [27,28]. Likewise, previous studies [4,29] highlighted destruction caused by glucose toxicity. Second, several studies have pointed out that hypertonic PD solutions also affect systemic hemodynamic status [30]. Patients whose peritoneal physical characteristics changed as a result of glucose uptake showed poor mortality outcomes in an observational cohort study [31]. Our finding is also in agreement with a number of clinical research studies, including those by Krediet et al. [32], and Li and Chow [33]. They asserted that exposure to glucose-based PD significantly increased the risk of mortality by CVD. Unfortunately, the cause of at-home deaths could not be determined in our study, because a category of assumed general-cause mortality was mostly used for deaths outside the hospital; therefore, the number of CVD deaths may have been underestimated. In addition, we further discovered that the median survival time of the original PD group was around 48 months, which was longer than that of the high-glucose-concentration group by 25 months. This finding is in agreement with the previous study by Korbet and Rodby [34]. In their work, peritoneal transport properties during the first 2 to 4 years of PD normally remained stable. Later, patients who had undergone PD treatment for more than 4 years had the potential to experience a change in peritoneal solute transport and a concomitant loss of ultrafiltration. Similarly, a population-based cohort study [35], despite a relatively small sample size, found that it was possible to preserve peritoneal function for more than 5 years in patients who were given only low-strength glucose solutions, whereas there was a negative outcome when higher-tonicity solutions were used. To summarize, these facts support and could theoretically explain why continuous exposure to the highly hypertonic solution (serialized PD) was the factor most closely associated with an increased risk of death in our analysis.
- Nonetheless, avoiding the use of highly hypertonic glucose solutions is not possible for glucose-based PD modalities; however, the shuffle PD regimen, despite its increased mortality risk, may be an alternative choice considering the recommendations in both ISPD guidelines [11,12]. These recommendations for the temporary use of hypertonic solutions are in line with the shuffle PD regimen, in which patients were able to survive longer than those who received a highly hypertonic glucose solution. Many regimens attempt to slow the progressive deleterious effects from higher-concentration glucose solutions, such as the combination exchange regimen, which alternates 1.5% dextrose for 3 exchanges with 1 exchange with 4.2% dextrose, as described in the study of Holmes and Shockley [36]. Regarding this, our results suggest that the shuffle regimen, with alternations between 1.5 and 2.5% PD solution, yielded a lower risk than 4.2% dextrose. This regimen may be an effective choice to reduce adverse outcomes. Therefore, our finding can bridge the gap between clinical practice and theoretical suggestions. The continuous use of a long-term highly hypertonic solution is a modifiable factor that affects PD survival, and continuous exchange at higher concentrations should be cautioned against as a first regimen of treatment.
- This study has some limitations. First, only one commercial PD solution was available for this study, and it was carried out at a single center; therefore, the possible effects of divergent dialysate compositions and between-center differences cannot be dismissed. Second, we were unable to quantify the exact ultrafiltration loss and severity of peritoneal transport deterioration because of the absence of complete data from the peritoneal equilibration test. Third, data regarding the underlying causes of chronic kidney disease were not available at sufficient levels for analysis, because most of the causes were classified as unknown disease and DM. Therefore, this parameter was not useful for interpreting our findings. Finally, accounting for competing risks, such as switching treatment to hemodialysis, should be considered for further analyses to assess the accuracy of the current results.
- In conclusion, evidence from the current analysis affirmed that frequent and continuous exposure to high levels of glucose PD solution significantly contributed to the risk of mortality, with a 2-fold increased risk of survival attenuation. No standards for prescriptions exist, and the higher-concentration solutions are often ordered. These main findings are widely applicable and are indicative of the benefit-risk balance of this issue in many parts of the world. The present study also proposes a simple alternative strategy for avoiding this effect by interrupting continuity in daily exchanges. We urge caution in the use of high-glucose-based solutions in clinical practice.
DISCUSSION
ACKNOWLEDGEMENTS
-
CONFLICT OF INTEREST
The authors have no conflicts of interest associated with the material presented in this paper.
Notes

Values are presented as number (%).
PD, peritoneal dialysis; Med, median; IQR, interquartile range (25th-75th); SD, standard deviation; Min, minimum; Max, maximum; RUO, residual urine output; Hb, hemoglobin; Alb, albumin; DM, diabetes mellitus; CVD, cardiovascular disease; PDitis, history of peritoneal dialysis-related peritonitis; TiPD, length of time on PD.
| Variables | Median time (mo) | Person-time (mo) | HR (95% CI) |
|---|---|---|---|
| Treatment regimen (PD) | |||
| Original | 48.9 | 3673 | 1.0 (reference) |
| Shuffle | 43.7 | 1823 | 1.5 (0.9, 2.3)† |
| Serialized | 25.1 | 1108 | 2.2 (1.3, 3.4)** |
| Gender | |||
| Men | 44.0 | 3545 | 1.0 (reference) |
| Women | 35.0 | 3059 | 1.1 (0.8, 1.6)† |
| Age (each year increase, y) | 1.1 (1.0, 1.1)* | ||
| <60 | 44.0 | 4064 | 1.0 (reference) |
| ≥60 | 25.0 | 2540 | 1.3 (0.9, 1.9)† |
| RUO (mL/d) | |||
| <200 | 26.3 | 2013 | 1.0 (reference) |
| ≥200 | 48.6 | 4591 | 0.4 (0.3, 0.7)** |
| Hb (g/dL) | |||
| <10 | 29.0 | 3306 | 1.0 (reference) |
| ≥10 | 56.7 | 3298 | 0.4 (0.3, 0.6)** |
| Serum albumin (g/dL) | |||
| ≤2.5 | 22.7 | 2672 | 1.0 (reference) |
| >2.5 | >60.0 | 3932 | 0.2 (0.1, 0.3)** |
| DM (%) | |||
| No | 43.9 | 4387 | 1.0 (reference) |
| Yes | 30.2 | 2217 | 1.5 (1.0, 2.2)* |
| CVD | |||
| No | 38.5 | 6463 | 1.0 (reference) |
| Yes | 31.8 | 141 | 2.7 (1.7, 5.0)* |
| PDitis | |||
| No | 54.0 | 2768 | 1.0 (reference) |
| Yes | 28.0 | 3836 | 1.4 (0.9, 2.0)† |
| TiPD (each month increase, mo) | 0.8 (0.8, 0.9)** |
| Potential variables | aHR (95%CI)1 |
|---|---|
| Treatment regimens (PD) | |
| Original | 1.0 (reference) |
| Shuffle | 2.2 (1.4, 3.4)** |
| Serialized | 2.6 (1.6, 4.6)** |
| Hb (each unit increase, g/dL) | 0.8 (0.7, 0.9)* |
| <10 | 1.0 (reference)* |
| ≥10 | 0.6 (0.3, 0.9) |
| Alb (each unit increase, g/dL) | 0.6 (0.4, 0.8)** |
| <2.5 | 1.0 (reference)** |
| ≥2.5 | 0.3 (0.2, 0.4) |
| RUO (mL/d) | |
| <200 | 1.0 (reference) |
| ≥200 | 0.6 (0.4, 0.8)* |
| Age (each year increase, y) | 1.0 (1.0, 1.1)* |
| TiPD (each month increase, mo) | 0.8 (0.8, 0.9)** |
- 1. Kendrick J, Teitelbaum I. Strategies for improving long-term survival in peritoneal dialysis patients. Clin J Am Soc Nephrol 2010;5(6):1123-1131ArticlePubMed
- 2. Mateijsen MA, van der Wal AC, Hendriks PM, Zweers MM, Mulder J, Struijk DG, et al. Vascular and interstitial changes in the peritoneum of CAPD patients with peritoneal sclerosis. Perit Dial Int 1999;19(6):517-525ArticlePubMedPDF
- 3. Teixeira JP, Combs SA, Teitelbaum I. Peritoneal dialysis: update on patient survival. Clin Nephrol 2015;83(1):1-10Article
- 4. Al-Hwiesh AK, Shawarby MA, Abdul-Rahman IS, Al-Oudah N, Al-Dhofairy B, Divino-Filho JC, et al. Changes in peritoneal membrane with different peritoneal dialysis solutions: is there a difference? Hong Kong J Nephrol 2016;19: 7-18Article
- 5. Wen Y, Guo Q, Yang X, Wu X, Feng S, Tan J, et al. High glucose concentrations in peritoneal dialysate are associated with all-cause and cardiovascular disease mortality in continuous ambulatory peritoneal dialysis patients. Perit Dial Int 2015;35(1):70-77ArticlePubMedPMC
- 6. Kadota A, Hozawa A, Okamura T, Kadowak T, Nakmaura K, Murakami Y, et al. Relationship between metabolic risk factor clustering and cardiovascular mortality stratified by high blood glucose and obesity: NIPPON DATA90, 1990-2000. Diabetes Care 2007;30(6):1533-1538ArticlePubMed
- 7. Mistry CD, Gokal R. Optimal use of glucose polymer (icodextrin) in peritoneal dialysis. Perit Dial Int 1996;16 Suppl 1: S104-S108ArticlePubMedPDF
- 8. Freida P, Wilkie M, Jenkins S, Dallas F, Issad B. The contribution of combined crystalloid and colloid osmosis to fluid and sodium management in peritoneal dialysis. Kidney Int 2008;73 Suppl 108: S102-S111Article
- 9. Bonomini M, Pandolfi A, Di Liberato L, Di Silvestre S, Cnops Y, Di Tomo P, et al. L-carnitine is an osmotic agent suitable for peritoneal dialysis. Kidney Int 2011;80(6):645-654ArticlePubMed
- 10. Cho Y, Johnson DW, Badve S, Craig JC, Strippoli GF, Wiggins KJ. Impact of icodextrin on clinical outcomes in peritoneal dialysis: a systematic review of randomized controlled trials. Nephrol Dial Transplant 2013;28(7):1899-1907ArticlePubMedPDF
- 11. Li PK, Szeto CC, Piraino B, de Arteaga J, Fan S, Figueiredo AE, et al. ISPD peritonitis recommendations: 2016 update on prevention and treatment. Perit Dial Int 2016;36(5):481-508ArticlePubMedPMC
- 12. Oei E, Fan S. Peritoneal dialysis adequacy in elderly patients. Perit Dial Int 2015;35(6):635-639ArticlePubMedPMC
- 13. Rocco M, Soucie JM, Pastan S, Mcclellan WM. Peritoneal dialysis adequacy and risk of death. Kidney Int 2000;58(1):446-457ArticlePubMed
- 14. Jansen MA, Termorshuizen F, Korevaar JC, Dekker FW, Boeschoten E, Krediet RT. Predictors of survival in anuric peritoneal dialysis patients. Kidney Int 2005;68(3):1199-1205ArticlePubMed
- 15. Muñoz de Bustillo E, Borrás F, Gómez-Roldán C, Pérez-Contreras FJ, Olivares J, García R, et al. Impact of peritonitis on long-term survival of peritoneal dialysis patients. Nefrologia 2011;31(6):723-732PubMed
- 16. Tong J, Liu M, Li H, Luo Z, Zhong X, Huang J, et al. Mortality and associated risk factors in dialysis patients with cardiovascular disease. Kidney Blood Press Res 2016;41(4):479-487ArticlePubMed
- 17. Wu HY, Hung KY, Huang JW, Chen YM, Tsai TJ, Wu KD. Initial glucose load predicts technique survival in patients on chronic peritoneal dialysis. Am J Nephrol 2008;28(5):765-771ArticlePubMed
- 18. Schoenfeld DA. Sample-size formula for the proportional-hazards regression model. Biometrics 1983;39(2):499-503ArticlePubMed
- 19. Schemper M, Smith TL. A note on quantifying follow-up in studies of failure time. Control Clin Trials 1996;17(4):343-346ArticlePubMed
- 20. Avram MM, Blaustein D, Fein PA, Goel N, Chattopadhyay J, Mittman N. Hemoglobin predicts long-term survival in dialysis patients: a 15-year single-center longitudinal study and a correlation trend between prealbumin and hemoglobin: management of comorbidities in kidney disease in the 21st century: anemia and bone disease. Kidney Int 2003;64 Suppl 87: S6-S11Article
- 21. Krediet RT, Lindholm B, Rippe B. Pathophysiology of peritoneal membrane failure. Perit Dial Int 2000;20 Suppl 4: S22-S42ArticlePubMedPDF
- 22. Davies SJ, Mushahar L, Yu Z, Lambie M. Determinants of peritoneal membrane function over time. Semin Nephrol 2011;31(2):172-182ArticlePubMed
- 23. Hassan K, Hassan F, Edgem R, Moshe S, Hassan S. The impact of the peritoneal glucose load index on hydration status and inflammation in peritoneal dialysis patients. J Int Med Res 2015;43(1):42-53ArticlePubMed
- 24. Holmes CJ. Reducing cardiometabolic risk in peritoneal dialysis patients: role of the dialysis solution. J Diabetes Sci Technol 2009;3(6):1472-1480ArticlePubMedPMC
- 25. Simon F, Tapia P, Armisen R, Echeverria C, Gatica S, Vallejos A, et al. Human peritoneal mesothelial cell death induced by high-glucose hypertonic solution involves Ca2+ and Na+ ions and oxidative stress with the participation of PKC/NOX2 and PI3K/Akt pathways. Front Physiol 2017;8: 379ArticlePubMedPMC
- 26. Kang DH, Hong YS, Lim HJ, Choi JH, Han DS, Yoon KI. High glucose solution and spent dialysate stimulate the synthesis of transforming growth factor-beta1 of human peritoneal mesothelial cells: effect of cytokine costimulation. Perit Dial Int 1999;19(3):221-230ArticlePubMedPDF
- 27. Krediet RT, Zweers MM, van Westrhenen R, Zegwaard A, Struijk DG. Effects of reducing the lactate and glucose content of PD solutions on the peritoneum. Is the future GLAD? NDT Plus 2008;1(Suppl 4):iv56-iv62ArticlePubMedPMCPDF
- 28. Lv ZD, Wang HB, Li FN, Wu L, Liu C, Nie G, et al. TGF-β1 induces peritoneal fibrosis by activating the Smad2 pathway in mesothelial cells and promotes peritoneal carcinomatosis. Int J Mol Med 2012;29(3):373-379PubMed
- 29. Baroni G, Schuinski A, de Moraes TP, Meyer F, Pecoits-Filho R. Inflammation and the peritoneal membrane: causes and impact on structure and function during peritoneal dialysis. Mediators Inflamm 2012;2012: 912595ArticlePubMedPMCPDF
- 30. Selby NM, Fialova J, Burton JO, McIntyre CW. The haemodynamic and metabolic effects of hypertonic-glucose and amino-acid-based peritoneal dialysis fluids. Nephrol Dial Transplant 2007;22(3):870-879ArticlePubMedPDF
- 31. Rumpsfeld M, McDonald SP, Johnson DW. Higher peritoneal transport status is associated with higher mortality and technique failure in the Australian and New Zealand peritoneal dialysis patient populations. J Am Soc Nephrol 2006;17(1):271-278ArticlePubMed
- 32. Krediet RT, Balafa O. Cardiovascular risk in the peritoneal dialysis patient. Nat Rev Nephrol 2010;6(8):451-460ArticlePubMedPDF
- 33. Li PK, Chow KM. The clinical and epidemiological aspects of vascular mortality in chronic peritoneal dialysis patients. Perit Dial Int 2005;25 Suppl 3: S80-S83ArticlePubMedPDF
- 34. Korbet S, Rodby R. Causes, diagnosis, and treatment of peritoneal membrane failure. In: Henrich WL, editor. Principles and practice of dialysis. 2nd ed. Baltimore: Williams and Wilkins; 1998. p. 185-206
- 35. Davies SJ, Phillips L, Naish PF, Russell GI. Peritoneal glucose exposure and changes in membrane solute transport with time on peritoneal dialysis. J Am Soc Nephrol 2001;12(5):1046-1051ArticlePubMed
- 36. Holmes CJ, Shockley TR. Strategies to reduce glucose exposure in peritoneal dialysis patients. Perit Dial Int 2000;20 Suppl 2: S37-S41ArticlePubMedPDF
REFERENCES
Figure & Data
References
Citations
- Associations of Glucometabolic Indices with Aortic Stiffness in Patients Undergoing Peritoneal Dialysis with and without Diabetes Mellitus
Chi-Chong Tang, Jen-Pi Tsai, Yi-Hsin Chen, Szu-Chun Hung, Yu-Li Lin, Bang-Gee Hsu
International Journal of Molecular Sciences.2023; 24(23): 17094. CrossRef
 PubReader
 ePub Link
 Cite
Cite